RBS 2012 Annual Report Download - page 168
Download and view the complete annual report
Please find page 168 of the 2012 RBS annual report below. You can navigate through the pages in the report by either clicking on the pages listed below, or by using the keyword search tool below to find specific information within the annual report.-
 1
1 -
2
-
3
-
4
-
5
-
6
-
7
-
8
-
9
-
10
-
11
-
12
-
13
-
14
-
15
-
16
-
17
-
18
-
19
-
20
-
21
-
22
-
23
-
24
-
25
-
26
-
27
-
28
-
29
-
30
-
31
-
32
-
33
-
34
-
35
-
36
-
37
-
38
-
39
-
40
-
41
-
42
-
43
-
44
-
45
-
46
-
47
-
48
-
49
-
50
-
51
-
52
-
53
-
54
-
55
-
56
-
57
-
58
-
59
-
60
-
61
-
62
-
63
-
64
-
65
-
66
-
67
-
68
-
69
-
70
-
71
-
72
-
73
-
74
-
75
-
76
-
77
-
78
-
79
-
80
-
81
-
82
-
83
-
84
-
85
-
86
-
87
-
88
-
89
-
90
-
91
-
92
-
93
-
94
-
95
-
96
-
97
-
98
-
99
-
100
-
101
-
102
-
103
-
104
-
105
-
106
-
107
-
108
-
109
-
110
-
111
-
112
-
113
-
114
-
115
-
116
-
117
-
118
-
119
-
120
-
121
-
122
-
123
-
124
-
125
-
126
-
127
-
128
-
129
-
130
-
131
-
132
-
133
-
134
-
135
-
136
-
137
-
138
-
139
-
140
-
141
-
142
-
143
-
144
-
145
-
146
-
147
-
148
-
149
-
150
-
151
-
152
-
153
-
154
-
155
-
156
-
157
-
 158
158 -
 159
159 -
 160
160 -
 161
161 -
 162
162 -
 163
163 -
 164
164 -
 165
165 -
 166
166 -
 167
167 -
 168
168 -
 169
169 -
 170
170 -
 171
171 -
 172
172 -
 173
173 -
 174
174 -
 175
175 -
 176
176 -
 177
177 -
 178
178 -
179
-
180
-
181
-
182
-
183
-
184
-
185
-
186
-
187
-
188
-
189
-
190
-
191
-
192
-
193
-
194
-
195
-
196
-
197
-
198
-
199
-
200
-
201
-
202
-
203
-
204
-
205
-
206
-
207
-
208
-
209
-
210
-
211
-
212
-
213
-
214
-
215
-
216
-
217
-
218
-
219
-
220
-
221
-
222
-
223
-
224
-
225
-
226
-
227
-
228
-
229
-
230
-
231
-
232
-
233
-
234
-
235
-
236
-
237
-
238
-
239
-
240
-
241
-
242
-
243
-
244
-
245
-
246
-
247
-
248
-
249
-
250
-
251
-
252
-
253
-
254
-
255
-
256
-
257
-
258
-
259
-
260
-
261
-
262
-
263
-
264
-
265
-
266
-
267
-
268
-
269
-
270
-
271
-
272
-
273
-
274
-
275
-
276
-
277
-
278
-
279
-
280
-
281
-
282
-
283
-
284
-
285
-
286
-
287
-
288
-
289
-
290
-
291
-
292
-
293
-
294
-
295
-
296
-
297
-
298
-
299
-
300
-
301
-
302
-
303
-
304
-
305
-
306
-
307
-
308
-
309
-
310
-
311
-
312
-
313
-
314
-
315
-
316
-
317
-
318
-
319
-
320
-
321
-
322
-
323
-
324
-
325
-
326
-
327
-
328
-
329
-
330
-
331
-
332
-
333
-
334
-
335
-
336
-
337
-
338
-
339
-
340
-
341
-
342
-
343
-
344
-
345
-
346
-
347
-
348
-
349
-
350
-
351
-
352
-
353
-
354
-
355
-
356
-
357
-
358
-
359
-
360
-
361
-
362
-
363
-
364
-
365
-
366
-
367
-
368
-
369
-
370
-
371
-
372
-
373
-
374
-
375
-
376
-
377
-
378
-
379
-
380
-
381
-
382
-
383
-
384
-
385
-
386
-
387
-
388
-
389
-
390
-
391
-
392
-
393
-
394
-
395
-
396
-
397
-
398
-
399
-
400
-
401
-
402
-
403
-
404
-
405
-
406
-
407
-
408
-
409
-
410
-
411
-
412
-
413
-
414
-
415
-
416
-
417
-
418
-
419
-
420
-
421
-
422
-
423
-
424
-
425
-
426
-
427
-
428
-
429
-
430
-
431
-
432
-
433
-
434
-
435
-
436
-
437
-
438
-
439
-
440
-
441
-
442
-
443
-
444
-
445
-
446
-
447
-
448
-
449
-
450
-
451
-
452
-
453
-
454
-
455
-
456
-
457
-
458
-
459
-
460
-
461
-
462
-
463
-
464
-
465
-
466
-
467
-
468
-
469
-
470
-
471
-
472
-
473
-
474
-
475
-
476
-
477
-
478
-
479
-
480
-
481
-
482
-
483
-
484
-
485
-
486
-
487
-
488
-
489
-
490
-
491
-
492
-
493
-
494
-
495
-
496
-
497
-
498
-
499
-
500
-
501
-
502
-
503
-
504
-
505
-
506
-
507
-
508
-
509
-
510
-
511
-
512
-
513
-
514
-
515
-
516
-
517
-
518
-
519
-
520
-
521
-
522
-
523
-
524
-
525
-
526
-
527
-
528
-
529
-
530
-
531
-
532
-
533
-
534
-
535
-
536
-
537
-
538
-
539
-
540
-
541
-
542
-
543
 |
 |

166
Business review Risk and balance sheet management continued
Credit risk assets*: Sector and geographical regional analysis continued
x The Group’s transport sector portfolio includes £10.6 billion of asset-
backed exposure to ocean-going vessels. Conditions remained poor
across the major shipping market segments in 2012, with low
charter rates and vessel values. A key protection for the Group is
the minimum security covenant. This covenant is tested each
quarter on an individual vessel basis to ensure prompt remedial
action is taken if values fall significantly below agreed loan coverage
ratios. There was an increase in the number of clients suffering
liquidity issues or failing to meet their minimum security covenant
and a commensurate rise in referrals to the Watchlist and the Global
Restructuring Group (GRG). At 31 December 2012, 20% of the
Group’s exposure to this sector was in Watchlist Red and the
amount of loans in default were £687 million. The impairment charge
for the year was c.£0.1 billion and the provision balance as at 31
December 2012 stood at c.£0.2 billion. The Group’s exposure to the
shipping sector (including shipping related infrastructure) declined
by 3.5% in 2012 as a result of amortisation and foreign exchange
movements.
x Exposure to healthcare of £10.0 billion at year end is included in the
business services sector. It is heavily biased towards the UK health
sector which represents 68% of the exposure. There was no
significant change in the asset quality or size of this portfolio in 2012.
Challenging market conditions persist in the nursing home sub-
sector and as a result the Group has tightened its risk appetite and
further strengthened its transactional controls and policies during the
year.
x Core personal lending continued to rise, driven by UK mortgages.
This expansion is in line with Group strategy and has no detrimental
impact on credit quality (for more commentary refer to Key credit
portfolios: Residential mortgages on page 186). The increase was
partially offset by reduced unsecured exposures.
Asset quality
Internal reporting and oversight of risk assets is principally differentiated by credit grades. Customers are assigned credit grades based on various credit
grading models that reflect the key drivers of default for each customer type. All credit grades across the Group map to both a Group level asset quality
scale, used for external financial reporting, and a master grading scale for wholesale exposures, used for internal management reporting across
portfolios. Accordingly, measures of risk exposure may be readily aggregated and reported at increasing levels of granularity depending on stakeholder
or business need. Performing loans are defined as AQ1-AQ9 (where the PD is less than 100%) and non-performing loans as AQ10 (where the PD is
100%).
Exposures are allocated to asset quality bands on the basis of statistically driven models which produce an estimate of default rate. The variables
included in the models vary by product and geography. For portfolios secured on residential property these models typically include measures of
delinquency and loan to value as well as other differentiating characteristics such as bureau score, product features or associated account performance
information.
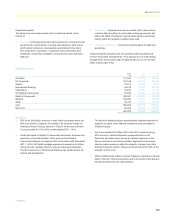
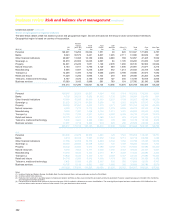
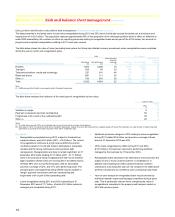
The table below shows credit risk assets by asset quality (AQ) band:
2012 2011 2010
Asset
quality band
Probability of
default range Core
£m
Non-Core
£m
Total
£m
Total
%
Core
£m
Non-Core
£m
Total
£m
Total
%
Core
£m
Non-Core
£m
Total
£m
Total
%
AQ1 0% - 0.034% 131,772 7,428 139,200 22.2 195,826 13,732 209,558 31.1 175,793 17,728 193,521 27.8
AQ2 0.034% - 0.048% 25,334 2,241 27,575 4.4 18,366 2,915 21,281 3.2 18,274 2,526 20,800 3.0
AQ3 0.048% - 0.095% 43,925 2,039 45,964 7.3 27,082 2,883 29,965 4.4 26,244 4,259 30,503 4.4
AQ4 0.095% - 0.381% 112,589 6,438 119,027 19.0 65,491 9,636 75,127 11.1 64,277 15,052 79,329 11.4
AQ5 0.381% - 1.076% 92,130 7,588 99,718 15.9 92,503 10,873 103,376 15.3 90,639 18,767 109,406 15.7
AQ6 1.076% - 2.153% 45,808 5,525 51,333 8.2 67,260 6,636 73,896 11.0 73,367 12,913 86,280 12.4
AQ7 2.153% - 6.089% 32,720 5,544 38,264 6.1 36,567 8,133 44,700 6.6 41,399 10,451 51,850 7.5
AQ8 6.089% - 17.222% 13,091 1,156 14,247 2.4 11,921 3,320 15,241 2.3 15,300 4,308 19,608 2.8
AQ9 17.222% - 100% 8,849 2,073 10,922 1.8 12,710 5,024 17,734 2.6 11,398 8,621 20,019 2.9
AQ10 100% 21,562 22,845 44,407 7.1 20,017 25,020 45,037 6.7 17,994 25,005 42,999 6.2
Other (1) 32,709 2,343 35,052 5.6
34,392 4,537 38,929 5.7 34,839 5,753 40,592 5.9
560,489 65,220 625,709 100 582,135 92,709 674,844 100 569,524 125,383 694,907 100
Note:
(1) Largely comprises certain of the Group’s portfolios covered by the standardised approach, for which a probability of default equivalent to those assigned to assets covered by the internal ratings
based approach is not available.
*unaudited