RBS 2012 Annual Report Download - page 184
Download and view the complete annual report
Please find page 184 of the 2012 RBS annual report below. You can navigate through the pages in the report by either clicking on the pages listed below, or by using the keyword search tool below to find specific information within the annual report.-
 1
1 -
2
-
3
-
4
-
5
-
6
-
7
-
8
-
9
-
10
-
11
-
12
-
13
-
14
-
15
-
16
-
17
-
18
-
19
-
20
-
21
-
22
-
23
-
24
-
25
-
26
-
27
-
28
-
29
-
30
-
31
-
32
-
33
-
34
-
35
-
36
-
37
-
38
-
39
-
40
-
41
-
42
-
43
-
44
-
45
-
46
-
47
-
48
-
49
-
50
-
51
-
52
-
53
-
54
-
55
-
56
-
57
-
58
-
59
-
60
-
61
-
62
-
63
-
64
-
65
-
66
-
67
-
68
-
69
-
70
-
71
-
72
-
73
-
74
-
75
-
76
-
77
-
78
-
79
-
80
-
81
-
82
-
83
-
84
-
85
-
86
-
87
-
88
-
89
-
90
-
91
-
92
-
93
-
94
-
95
-
96
-
97
-
98
-
99
-
100
-
101
-
102
-
103
-
104
-
105
-
106
-
107
-
108
-
109
-
110
-
111
-
112
-
113
-
114
-
115
-
116
-
117
-
118
-
119
-
120
-
121
-
122
-
123
-
124
-
125
-
126
-
127
-
128
-
129
-
130
-
131
-
132
-
133
-
134
-
135
-
136
-
137
-
138
-
139
-
140
-
141
-
142
-
143
-
144
-
145
-
146
-
147
-
148
-
149
-
150
-
151
-
152
-
153
-
154
-
155
-
156
-
157
-
158
-
159
-
160
-
161
-
162
-
163
-
164
-
165
-
166
-
167
-
168
-
169
-
170
-
171
-
172
-
173
-
 174
174 -
 175
175 -
 176
176 -
 177
177 -
 178
178 -
 179
179 -
 180
180 -
 181
181 -
 182
182 -
 183
183 -
 184
184 -
 185
185 -
 186
186 -
 187
187 -
 188
188 -
 189
189 -
 190
190 -
 191
191 -
 192
192 -
 193
193 -
 194
194 -
195
-
196
-
197
-
198
-
199
-
200
-
201
-
202
-
203
-
204
-
205
-
206
-
207
-
208
-
209
-
210
-
211
-
212
-
213
-
214
-
215
-
216
-
217
-
218
-
219
-
220
-
221
-
222
-
223
-
224
-
225
-
226
-
227
-
228
-
229
-
230
-
231
-
232
-
233
-
234
-
235
-
236
-
237
-
238
-
239
-
240
-
241
-
242
-
243
-
244
-
245
-
246
-
247
-
248
-
249
-
250
-
251
-
252
-
253
-
254
-
255
-
256
-
257
-
258
-
259
-
260
-
261
-
262
-
263
-
264
-
265
-
266
-
267
-
268
-
269
-
270
-
271
-
272
-
273
-
274
-
275
-
276
-
277
-
278
-
279
-
280
-
281
-
282
-
283
-
284
-
285
-
286
-
287
-
288
-
289
-
290
-
291
-
292
-
293
-
294
-
295
-
296
-
297
-
298
-
299
-
300
-
301
-
302
-
303
-
304
-
305
-
306
-
307
-
308
-
309
-
310
-
311
-
312
-
313
-
314
-
315
-
316
-
317
-
318
-
319
-
320
-
321
-
322
-
323
-
324
-
325
-
326
-
327
-
328
-
329
-
330
-
331
-
332
-
333
-
334
-
335
-
336
-
337
-
338
-
339
-
340
-
341
-
342
-
343
-
344
-
345
-
346
-
347
-
348
-
349
-
350
-
351
-
352
-
353
-
354
-
355
-
356
-
357
-
358
-
359
-
360
-
361
-
362
-
363
-
364
-
365
-
366
-
367
-
368
-
369
-
370
-
371
-
372
-
373
-
374
-
375
-
376
-
377
-
378
-
379
-
380
-
381
-
382
-
383
-
384
-
385
-
386
-
387
-
388
-
389
-
390
-
391
-
392
-
393
-
394
-
395
-
396
-
397
-
398
-
399
-
400
-
401
-
402
-
403
-
404
-
405
-
406
-
407
-
408
-
409
-
410
-
411
-
412
-
413
-
414
-
415
-
416
-
417
-
418
-
419
-
420
-
421
-
422
-
423
-
424
-
425
-
426
-
427
-
428
-
429
-
430
-
431
-
432
-
433
-
434
-
435
-
436
-
437
-
438
-
439
-
440
-
441
-
442
-
443
-
444
-
445
-
446
-
447
-
448
-
449
-
450
-
451
-
452
-
453
-
454
-
455
-
456
-
457
-
458
-
459
-
460
-
461
-
462
-
463
-
464
-
465
-
466
-
467
-
468
-
469
-
470
-
471
-
472
-
473
-
474
-
475
-
476
-
477
-
478
-
479
-
480
-
481
-
482
-
483
-
484
-
485
-
486
-
487
-
488
-
489
-
490
-
491
-
492
-
493
-
494
-
495
-
496
-
497
-
498
-
499
-
500
-
501
-
502
-
503
-
504
-
505
-
506
-
507
-
508
-
509
-
510
-
511
-
512
-
513
-
514
-
515
-
516
-
517
-
518
-
519
-
520
-
521
-
522
-
523
-
524
-
525
-
526
-
527
-
528
-
529
-
530
-
531
-
532
-
533
-
534
-
535
-
536
-
537
-
538
-
539
-
540
-
541
-
542
-
543
 |
 |

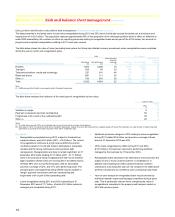
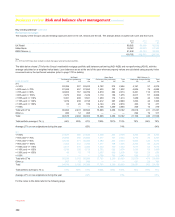
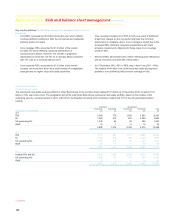
182
Business review Risk and balance sheet management continued
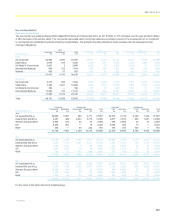
Key credit portfolios*: Commercial real estate continued
By sub-sector (1)
UK
(excl NI) (2)
£m
Ireland
(ROI and NI) (2)
£m
Western
Europe
(other)
£m
US
£m
RoW (2)
£m
Total
£m
2012
Residential 10,344 6,701 403 996 242 18,686
Office 6,112 1,132 1,851 99 176 9,370
Retail 7,529 1,492 1,450 117 129 10,717
Industrial 3,550 476 143 4 39 4,212
Mixed/other 9,512 3,785 2,573 4,010 175 20,055
37,047 13,586 6,420 5,226 761 63,040
2011
Residential 12,870 7,449 1,100 1,325 319 23,063
Office 7,155 1,354 2,246 404 352 11,511
Retail 8,709 1,641 1,891 285 275 12,801
Industrial 4,317 507 520 24 105 5,473
Mixed/other 9,670 4,235 3,001 4,898 194 21,998
42,721 15,186 8,758 6,936 1,245 74,846
2010
Residential 15,543 7,726 685 1,471 523 25,948
Office 8,539 1,178 2,878 663 891 14,149
Retail 10,607 1,668 1,888 1,025 479 15,667
Industrial 4,912 515 711 80 106 6,324
Mixed/other 9,796 4,480 5,116 5,646 284 25,322
49,397 15,567 11,278 8,885 2,283 87,410
Notes:
(1) Excludes commercial real estate lending in Wealth as these loans are generally supported by personal guarantees in addition to collateral. This portfolio, which totalled £1.4 billion at 31 December
2012 (2011 - £1.3 billion) continues to perform in line with expectations and requires minimal provisions.
(2) ROI: Republic of Ireland; NI: Northern Ireland; RoW: rest of world.
Key points
x In line with the Group’s strategy, the overall exposure to commercial
real estate fell during 2012, across all geographies. The overall mix
in terms of geography, sub-sector and investment versus
development remained broadly unchanged.
x Most of the decrease was in Non-Core and was due to repayments,
asset sales, and write-offs. The Non-Core portfolio totalled £26.4
billion (42% of the portfolio) at 31 December 2012 (2011 - £34.3
billion or 46% of the portfolio).
x The growth in Markets was caused by an increase in the inventory
of US commercial real estate loans earmarked for securitisation as
commercial mortgage-backed securities (CMBS). CMBS warehouse
activity is tightly controlled with limits on maximum portfolio size and
holding period, and marked-to-market on a daily basis.
x With the exception of exposure in Spain and Ireland, the Group had
minimal commercial real estate exposure in the peripheral eurozone
countries. Exposure in Spain was predominantly in the Non-Core
portfolio and totalled £1.6 billion (2011 - £2.3 billion), of which 31%
(2011 - 55%) was in default. The majority of the portfolio is managed
by GRG. The Spanish portfolio has already been subject to material
provisions, which are regularly assessed by reference to re-
appraised asset values. Asset values vary significantly by type and
geographic location. Refer to the Ulster Bank Group (Core and Non-
Core) section on page 192 for details on the exposure in Ireland.
x The UK portfolio is focused on London and the South East at
approximately 43% in 2012 (2011 - 44%) with the remainder spread
across other UK Regions.
x Speculative lending, defined by the Group as short-term lending to
property developers without sufficient pre-let revenue at origination
to support investment financing after practical completion,
represented less than 1% of the portfolio at 31 December 2012. The
Group’s appetite for originating speculative commercial real estate
lending is very limited and any such business requires senior
management approval.
x The commercial real estate sector is expected to remain challenging
in key markets and new business will be accommodated from run-off
of existing Core exposure. Over £5.5 billion of loans in UK Corporate
(Core and Non-Core) have been repaid over the last 12 months
whilst the risk profile of the remaining performing book has remained
relatively unchanged.
*unaudited