RBS 2012 Annual Report Download - page 64
Download and view the complete annual report
Please find page 64 of the 2012 RBS annual report below. You can navigate through the pages in the report by either clicking on the pages listed below, or by using the keyword search tool below to find specific information within the annual report.-
 1
1 -
2
-
3
-
4
-
5
-
6
-
7
-
8
-
9
-
10
-
11
-
12
-
13
-
14
-
15
-
16
-
17
-
18
-
19
-
20
-
21
-
22
-
23
-
24
-
25
-
26
-
27
-
28
-
29
-
30
-
31
-
32
-
33
-
34
-
35
-
36
-
37
-
38
-
39
-
40
-
41
-
42
-
43
-
44
-
45
-
46
-
47
-
48
-
49
-
50
-
51
-
52
-
53
-
 54
54 -
 55
55 -
 56
56 -
 57
57 -
 58
58 -
 59
59 -
 60
60 -
 61
61 -
 62
62 -
 63
63 -
 64
64 -
 65
65 -
 66
66 -
 67
67 -
 68
68 -
 69
69 -
 70
70 -
 71
71 -
 72
72 -
 73
73 -
 74
74 -
75
-
76
-
77
-
78
-
79
-
80
-
81
-
82
-
83
-
84
-
85
-
86
-
87
-
88
-
89
-
90
-
91
-
92
-
93
-
94
-
95
-
96
-
97
-
98
-
99
-
100
-
101
-
102
-
103
-
104
-
105
-
106
-
107
-
108
-
109
-
110
-
111
-
112
-
113
-
114
-
115
-
116
-
117
-
118
-
119
-
120
-
121
-
122
-
123
-
124
-
125
-
126
-
127
-
128
-
129
-
130
-
131
-
132
-
133
-
134
-
135
-
136
-
137
-
138
-
139
-
140
-
141
-
142
-
143
-
144
-
145
-
146
-
147
-
148
-
149
-
150
-
151
-
152
-
153
-
154
-
155
-
156
-
157
-
158
-
159
-
160
-
161
-
162
-
163
-
164
-
165
-
166
-
167
-
168
-
169
-
170
-
171
-
172
-
173
-
174
-
175
-
176
-
177
-
178
-
179
-
180
-
181
-
182
-
183
-
184
-
185
-
186
-
187
-
188
-
189
-
190
-
191
-
192
-
193
-
194
-
195
-
196
-
197
-
198
-
199
-
200
-
201
-
202
-
203
-
204
-
205
-
206
-
207
-
208
-
209
-
210
-
211
-
212
-
213
-
214
-
215
-
216
-
217
-
218
-
219
-
220
-
221
-
222
-
223
-
224
-
225
-
226
-
227
-
228
-
229
-
230
-
231
-
232
-
233
-
234
-
235
-
236
-
237
-
238
-
239
-
240
-
241
-
242
-
243
-
244
-
245
-
246
-
247
-
248
-
249
-
250
-
251
-
252
-
253
-
254
-
255
-
256
-
257
-
258
-
259
-
260
-
261
-
262
-
263
-
264
-
265
-
266
-
267
-
268
-
269
-
270
-
271
-
272
-
273
-
274
-
275
-
276
-
277
-
278
-
279
-
280
-
281
-
282
-
283
-
284
-
285
-
286
-
287
-
288
-
289
-
290
-
291
-
292
-
293
-
294
-
295
-
296
-
297
-
298
-
299
-
300
-
301
-
302
-
303
-
304
-
305
-
306
-
307
-
308
-
309
-
310
-
311
-
312
-
313
-
314
-
315
-
316
-
317
-
318
-
319
-
320
-
321
-
322
-
323
-
324
-
325
-
326
-
327
-
328
-
329
-
330
-
331
-
332
-
333
-
334
-
335
-
336
-
337
-
338
-
339
-
340
-
341
-
342
-
343
-
344
-
345
-
346
-
347
-
348
-
349
-
350
-
351
-
352
-
353
-
354
-
355
-
356
-
357
-
358
-
359
-
360
-
361
-
362
-
363
-
364
-
365
-
366
-
367
-
368
-
369
-
370
-
371
-
372
-
373
-
374
-
375
-
376
-
377
-
378
-
379
-
380
-
381
-
382
-
383
-
384
-
385
-
386
-
387
-
388
-
389
-
390
-
391
-
392
-
393
-
394
-
395
-
396
-
397
-
398
-
399
-
400
-
401
-
402
-
403
-
404
-
405
-
406
-
407
-
408
-
409
-
410
-
411
-
412
-
413
-
414
-
415
-
416
-
417
-
418
-
419
-
420
-
421
-
422
-
423
-
424
-
425
-
426
-
427
-
428
-
429
-
430
-
431
-
432
-
433
-
434
-
435
-
436
-
437
-
438
-
439
-
440
-
441
-
442
-
443
-
444
-
445
-
446
-
447
-
448
-
449
-
450
-
451
-
452
-
453
-
454
-
455
-
456
-
457
-
458
-
459
-
460
-
461
-
462
-
463
-
464
-
465
-
466
-
467
-
468
-
469
-
470
-
471
-
472
-
473
-
474
-
475
-
476
-
477
-
478
-
479
-
480
-
481
-
482
-
483
-
484
-
485
-
486
-
487
-
488
-
489
-
490
-
491
-
492
-
493
-
494
-
495
-
496
-
497
-
498
-
499
-
500
-
501
-
502
-
503
-
504
-
505
-
506
-
507
-
508
-
509
-
510
-
511
-
512
-
513
-
514
-
515
-
516
-
517
-
518
-
519
-
520
-
521
-
522
-
523
-
524
-
525
-
526
-
527
-
528
-
529
-
530
-
531
-
532
-
533
-
534
-
535
-
536
-
537
-
538
-
539
-
540
-
541
-
542
-
543
 |
 |

62
Business review continued
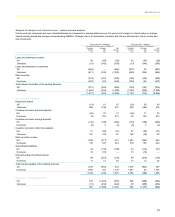
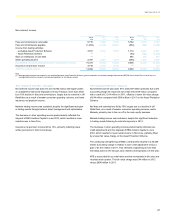
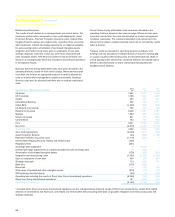
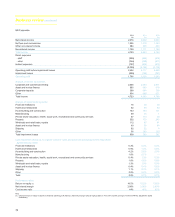
Impairment losses
Managed (1) Statutory
2012 2011 2010 2012 2011 2010
£m £m £m £m £m £m
New impairment losses 5,620 7,966 9,667 5,620 9,234 9,646
Less: recoveries of amounts previously written-off (341) (527) (411) (341) (527) (411)
Charge to income statement 5,279 7,439 9,256 5,279 8,707 9,235
Comprising:
Loan impairment losses 5,315 7,241 9,144 5,315 7,241 9,144
Securities
- sovereign debt impairment — — — — 1,099 —
- interest rate hedge adjustments on impaired available-for-sale
sovereign debt — — — — 169 —
- other (36) 198 112 (36) 198 91
Charge to income statement 5,279 7,439 9,256 5,279 8,707 9,235
Note:
(1) Managed basis excludes sovereign debt impairment and interest rate hedge adjustments on available-for-sale sovereign debt.
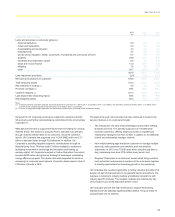
2012 compared with 2011 - managed and statutory
Loan impairment losses declined by £1,926 million to £5,315 million,
primarily driven by a £1,518 million fall in Non-Core impairments, mostly
in the Ulster Bank and commercial real estate portfolios.
Core loan impairments were down £408 million, or 12%, largely due to
lower default rates in UK Retail and an improved credit environment for
US Retail & Commercial, which helped drive impairment reductions of
£259 million and £165 million respectively. Core Ulster Bank impairments
stabilised, though still at a very high level (£1,364 million in 2012 versus
£1,384 million in 2011).
Loan impairments as a percentage of gross loans and advances
improved by 30 basis points, principally reflecting the improved credit
profile in Non-Core and the better US credit environment.
Loan impairment provisions rose to £21.3 billion, increasing coverage of
risk elements in lending to 52%, compared with 49% in 2011.
2011 compared with 2010 - managed
Impairment losses decreased by 20% compared with 2010, driven largely
by a £1,569 million reduction in Non-Core loan impairments, despite
continuing challenges in Ulster Bank and corporate real estate portfolios.
Retail & Commercial impairment losses fell by £153 million, driven by
improving credit metrics in UK Retail and US Retail & Commercial
partially offset by increases in Ulster Bank, largely reflecting a
deterioration in credit metrics on the mortgage portfolio, and a single
name provision in International Banking.
Total Core and Non-Core Ulster Bank impairment losses decreased by
4%, as the £223 million increase in Core Ulster Bank losses was more
than offset by a decrease in losses recognised in Non-Core.
2011 compared with 2010 - statutory
Impairment losses decreased by 6% compared with 2010, driven largely
by a £1,569 million reduction in Non-Core loan impairments, despite
continuing challenges in Ulster Bank and corporate real estate portfolios.
This was partially offset by impairments taken on the Group’s available-
for-sale bond portfolio, as a result of the decline in the value of Greek
sovereign bonds.
Retail & Commercial impairment losses fell by £227 million, driven by
improving credit metrics in UK Retail and US Retail & Commercial
partially offset by increases in Ulster Bank, largely reflecting a
deterioration in credit metrics on the mortgage portfolio, and a single
name provision in International Banking.
Total Core and Non-Core Ulster Bank impairment losses decreased by
4%, as the £223 million increase in Core Ulster Bank losses was more
than offset by a decrease in losses recognised in Non-Core.
The Group held Greek government bonds with a notional amount of
£1.45 billion. As a result of Greece’s continuing fiscal difficulties, the
Group recorded impairment charges on these bonds totalling £1,099
million during the year. These charges were recorded to write the bonds
down to their market price as at 31 December 2011 (c.21% of notional).