RBS 2012 Annual Report Download - page 18
Download and view the complete annual report
Please find page 18 of the 2012 RBS annual report below. You can navigate through the pages in the report by either clicking on the pages listed below, or by using the keyword search tool below to find specific information within the annual report.-
 1
1 -
2
-
3
-
4
-
5
-
6
-
7
-
 8
8 -
 9
9 -
 10
10 -
 11
11 -
 12
12 -
 13
13 -
 14
14 -
 15
15 -
 16
16 -
 17
17 -
 18
18 -
 19
19 -
 20
20 -
 21
21 -
 22
22 -
 23
23 -
 24
24 -
 25
25 -
 26
26 -
 27
27 -
 28
28 -
29
-
30
-
31
-
32
-
33
-
34
-
35
-
36
-
37
-
38
-
39
-
40
-
41
-
42
-
43
-
44
-
45
-
46
-
47
-
48
-
49
-
50
-
51
-
52
-
53
-
54
-
55
-
56
-
57
-
58
-
59
-
60
-
61
-
62
-
63
-
64
-
65
-
66
-
67
-
68
-
69
-
70
-
71
-
72
-
73
-
74
-
75
-
76
-
77
-
78
-
79
-
80
-
81
-
82
-
83
-
84
-
85
-
86
-
87
-
88
-
89
-
90
-
91
-
92
-
93
-
94
-
95
-
96
-
97
-
98
-
99
-
100
-
101
-
102
-
103
-
104
-
105
-
106
-
107
-
108
-
109
-
110
-
111
-
112
-
113
-
114
-
115
-
116
-
117
-
118
-
119
-
120
-
121
-
122
-
123
-
124
-
125
-
126
-
127
-
128
-
129
-
130
-
131
-
132
-
133
-
134
-
135
-
136
-
137
-
138
-
139
-
140
-
141
-
142
-
143
-
144
-
145
-
146
-
147
-
148
-
149
-
150
-
151
-
152
-
153
-
154
-
155
-
156
-
157
-
158
-
159
-
160
-
161
-
162
-
163
-
164
-
165
-
166
-
167
-
168
-
169
-
170
-
171
-
172
-
173
-
174
-
175
-
176
-
177
-
178
-
179
-
180
-
181
-
182
-
183
-
184
-
185
-
186
-
187
-
188
-
189
-
190
-
191
-
192
-
193
-
194
-
195
-
196
-
197
-
198
-
199
-
200
-
201
-
202
-
203
-
204
-
205
-
206
-
207
-
208
-
209
-
210
-
211
-
212
-
213
-
214
-
215
-
216
-
217
-
218
-
219
-
220
-
221
-
222
-
223
-
224
-
225
-
226
-
227
-
228
-
229
-
230
-
231
-
232
-
233
-
234
-
235
-
236
-
237
-
238
-
239
-
240
-
241
-
242
-
243
-
244
-
245
-
246
-
247
-
248
-
249
-
250
-
251
-
252
-
253
-
254
-
255
-
256
-
257
-
258
-
259
-
260
-
261
-
262
-
263
-
264
-
265
-
266
-
267
-
268
-
269
-
270
-
271
-
272
-
273
-
274
-
275
-
276
-
277
-
278
-
279
-
280
-
281
-
282
-
283
-
284
-
285
-
286
-
287
-
288
-
289
-
290
-
291
-
292
-
293
-
294
-
295
-
296
-
297
-
298
-
299
-
300
-
301
-
302
-
303
-
304
-
305
-
306
-
307
-
308
-
309
-
310
-
311
-
312
-
313
-
314
-
315
-
316
-
317
-
318
-
319
-
320
-
321
-
322
-
323
-
324
-
325
-
326
-
327
-
328
-
329
-
330
-
331
-
332
-
333
-
334
-
335
-
336
-
337
-
338
-
339
-
340
-
341
-
342
-
343
-
344
-
345
-
346
-
347
-
348
-
349
-
350
-
351
-
352
-
353
-
354
-
355
-
356
-
357
-
358
-
359
-
360
-
361
-
362
-
363
-
364
-
365
-
366
-
367
-
368
-
369
-
370
-
371
-
372
-
373
-
374
-
375
-
376
-
377
-
378
-
379
-
380
-
381
-
382
-
383
-
384
-
385
-
386
-
387
-
388
-
389
-
390
-
391
-
392
-
393
-
394
-
395
-
396
-
397
-
398
-
399
-
400
-
401
-
402
-
403
-
404
-
405
-
406
-
407
-
408
-
409
-
410
-
411
-
412
-
413
-
414
-
415
-
416
-
417
-
418
-
419
-
420
-
421
-
422
-
423
-
424
-
425
-
426
-
427
-
428
-
429
-
430
-
431
-
432
-
433
-
434
-
435
-
436
-
437
-
438
-
439
-
440
-
441
-
442
-
443
-
444
-
445
-
446
-
447
-
448
-
449
-
450
-
451
-
452
-
453
-
454
-
455
-
456
-
457
-
458
-
459
-
460
-
461
-
462
-
463
-
464
-
465
-
466
-
467
-
468
-
469
-
470
-
471
-
472
-
473
-
474
-
475
-
476
-
477
-
478
-
479
-
480
-
481
-
482
-
483
-
484
-
485
-
486
-
487
-
488
-
489
-
490
-
491
-
492
-
493
-
494
-
495
-
496
-
497
-
498
-
499
-
500
-
501
-
502
-
503
-
504
-
505
-
506
-
507
-
508
-
509
-
510
-
511
-
512
-
513
-
514
-
515
-
516
-
517
-
518
-
519
-
520
-
521
-
522
-
523
-
524
-
525
-
526
-
527
-
528
-
529
-
530
-
531
-
532
-
533
-
534
-
535
-
536
-
537
-
538
-
539
-
540
-
541
-
542
-
543
 |
 |

16
OUR BUSINESS AND OUR STRATEGY
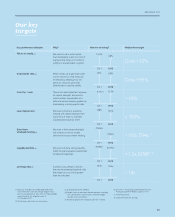
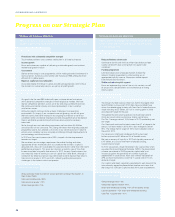
Progress on our Strategic Plan
Strategy and business objectives
Strategy and business objectives
RBS to deliver its strategy from a stable risk profile and
balance sheet, with each banking business self-funding
(1:1 loan:deposit ratio)
How are we going to do this?
Reduced balance sheet scale
Continue to de-risk and shrink our Non-Core balance sheet.
Careful control of future asset growth to support Core
customers’.
Funding programme
Limit over-reliance on wholesale markets to meet the
Group’s funding requirements, while building up an
appropriate liquidity reserve. Generate a stable deposit
base to fund each business.
Stable and robust capital support
Focus on implementing state of the art risk controls, run-off
of excess risk concentrations and maintenance of strong
equity capital.
Our progress so far
The Group’s funded balance sheet was further managed down
to £870 billion by the end of 2012. Non-Core and M&IB have
driven the deleveraging to date, with Non-Core’s funded balance
sheet standing at £57 billion, 22% of its starting point in 2008
and ahead of target for the year.
Throughout the restructuring process we have been able to
shrink our assets while sustaining a strong capital base.
Our Tier 1 leverage ratio of 15.0x times in 2012 comfortably met
our target.
Our Core bank continued to take in more than £1 of deposits for
every £1 of loans made in 2012 with a loan to deposit ratio of
90%. The Group met its target of 100% loan to deposit ratio at
the end of 2012.
Our reliance on short-term wholesale funding has been
further reduced to £42 billion or 5% of funded assets.
We had an excess of liquidity in 2012 with liquidity reserves of
£147 billion, or 3.5x our short-term wholesale funding,
surpassing our target.
In 2012, we passed a major milestone in our capital story when
we exited the Asset Protection Scheme (“APS”), the Government
scheme we entered in 2009 to provide capital relief and
insurance against the possibility of a further significant
deterioration in credit losses. Now, even without the benefit of
APS, we have maintained a Core Tier 1 capital ratio of 10.3%,
above our target.
Our capital ratio meets regulatory requirements well ahead of the
internationally agreed implementation timeline and shows that
the Group has sufficient capital to deal with future requirements.
Medium-term target
Group leverage ratio <18x
Group loan:deposit ratio of 100%
Short-term wholesale funding <10% of third party assets
Liquidity portfolio >1.5x short-term wholesale funding
Core Tier 1 capital ratio >10%
Strategy and business objectives
RBS to be based on enduring customer franchises with each business
capable of generating a sustainable return in excess of its cost of capital
How are we going to do this?
Franchises with substantial competitive strength
Track market positions and customer satisfaction in all Core businesses
Income growth
Focus on businesses capable of delivering sustainable growth and achieve
market-level growth in each
Cost control
Deliver on the Group’s cost programmes, whilst making essential investments in
our businesses. Achieve a cost:income ratio that places RBS among the most
efficient of its global peers.
Rigorous capital and cost allocation
Accurately deploy the Group’s capital and allocate appropriate costs to focus
the divisions on sustainable returns, as well as on profit growth.
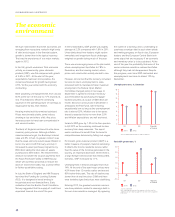
Our progress so far
Our goal is for the new RBS to be built upon customer-driven businesses
with substantial competitive strengths in their respective markets. We have
top tier competitive positions across all of our enduring customer franchises.
We continue to monitor closely and drive improvements in our customer
satisfaction scores.
Achieving growth continues to be a major challenge in our operating
environment. Put simply, if our customers are not growing, we will not grow.
We have restructured and invested in our ongoing businesses to serve our
customers better and deliver improved and enduring performance. We believe
there is additional upside to these franchises when economic recovery
takes hold.
So far, through our cost reduction programme, we have taken £3.6 billion
annualised out of our cost base. This, along with lower than originally projected
programme spend, has allowed us to invest in our Core franchises in order to
enhance our customer service and product offerings through improvements to
our technology and infrastructure.
In 2012 our Core cost:income ratio of 59% showed a further improvement
towards our target.
We use direct service usage, requirement for market funding and other
appropriate drivers to allocate costs accurately to the divisions. Capital is
allocated with a focus on sustainable risk-adjusted returns rather than short-term
performance prospects. This gives our divisions a realistic view of how their
income translates into profits and returns. In 2012, the only Core business that
was materially short of earning its cost of capital was Ulster Bank, although a
number of our other businesses have some work to do to improve their returns.
Core return on equity in 2012 was 9.8%, reflecting protracted economic
challenges in the areas in which we operate.
Medium-term target
All our principal Core businesses sustain positions amongst the leaders in
their chosen fields.
Core cost:income ratio <55%
Core return on equity >12%
Group leverage ratio <18x