RBS 2012 Annual Report Download - page 172
Download and view the complete annual report
Please find page 172 of the 2012 RBS annual report below. You can navigate through the pages in the report by either clicking on the pages listed below, or by using the keyword search tool below to find specific information within the annual report.-
 1
1 -
2
-
3
-
4
-
5
-
6
-
7
-
8
-
9
-
10
-
11
-
12
-
13
-
14
-
15
-
16
-
17
-
18
-
19
-
20
-
21
-
22
-
23
-
24
-
25
-
26
-
27
-
28
-
29
-
30
-
31
-
32
-
33
-
34
-
35
-
36
-
37
-
38
-
39
-
40
-
41
-
42
-
43
-
44
-
45
-
46
-
47
-
48
-
49
-
50
-
51
-
52
-
53
-
54
-
55
-
56
-
57
-
58
-
59
-
60
-
61
-
62
-
63
-
64
-
65
-
66
-
67
-
68
-
69
-
70
-
71
-
72
-
73
-
74
-
75
-
76
-
77
-
78
-
79
-
80
-
81
-
82
-
83
-
84
-
85
-
86
-
87
-
88
-
89
-
90
-
91
-
92
-
93
-
94
-
95
-
96
-
97
-
98
-
99
-
100
-
101
-
102
-
103
-
104
-
105
-
106
-
107
-
108
-
109
-
110
-
111
-
112
-
113
-
114
-
115
-
116
-
117
-
118
-
119
-
120
-
121
-
122
-
123
-
124
-
125
-
126
-
127
-
128
-
129
-
130
-
131
-
132
-
133
-
134
-
135
-
136
-
137
-
138
-
139
-
140
-
141
-
142
-
143
-
144
-
145
-
146
-
147
-
148
-
149
-
150
-
151
-
152
-
153
-
154
-
155
-
156
-
157
-
158
-
159
-
160
-
161
-
 162
162 -
 163
163 -
 164
164 -
 165
165 -
 166
166 -
 167
167 -
 168
168 -
 169
169 -
 170
170 -
 171
171 -
 172
172 -
 173
173 -
 174
174 -
 175
175 -
 176
176 -
 177
177 -
 178
178 -
 179
179 -
 180
180 -
 181
181 -
 182
182 -
183
-
184
-
185
-
186
-
187
-
188
-
189
-
190
-
191
-
192
-
193
-
194
-
195
-
196
-
197
-
198
-
199
-
200
-
201
-
202
-
203
-
204
-
205
-
206
-
207
-
208
-
209
-
210
-
211
-
212
-
213
-
214
-
215
-
216
-
217
-
218
-
219
-
220
-
221
-
222
-
223
-
224
-
225
-
226
-
227
-
228
-
229
-
230
-
231
-
232
-
233
-
234
-
235
-
236
-
237
-
238
-
239
-
240
-
241
-
242
-
243
-
244
-
245
-
246
-
247
-
248
-
249
-
250
-
251
-
252
-
253
-
254
-
255
-
256
-
257
-
258
-
259
-
260
-
261
-
262
-
263
-
264
-
265
-
266
-
267
-
268
-
269
-
270
-
271
-
272
-
273
-
274
-
275
-
276
-
277
-
278
-
279
-
280
-
281
-
282
-
283
-
284
-
285
-
286
-
287
-
288
-
289
-
290
-
291
-
292
-
293
-
294
-
295
-
296
-
297
-
298
-
299
-
300
-
301
-
302
-
303
-
304
-
305
-
306
-
307
-
308
-
309
-
310
-
311
-
312
-
313
-
314
-
315
-
316
-
317
-
318
-
319
-
320
-
321
-
322
-
323
-
324
-
325
-
326
-
327
-
328
-
329
-
330
-
331
-
332
-
333
-
334
-
335
-
336
-
337
-
338
-
339
-
340
-
341
-
342
-
343
-
344
-
345
-
346
-
347
-
348
-
349
-
350
-
351
-
352
-
353
-
354
-
355
-
356
-
357
-
358
-
359
-
360
-
361
-
362
-
363
-
364
-
365
-
366
-
367
-
368
-
369
-
370
-
371
-
372
-
373
-
374
-
375
-
376
-
377
-
378
-
379
-
380
-
381
-
382
-
383
-
384
-
385
-
386
-
387
-
388
-
389
-
390
-
391
-
392
-
393
-
394
-
395
-
396
-
397
-
398
-
399
-
400
-
401
-
402
-
403
-
404
-
405
-
406
-
407
-
408
-
409
-
410
-
411
-
412
-
413
-
414
-
415
-
416
-
417
-
418
-
419
-
420
-
421
-
422
-
423
-
424
-
425
-
426
-
427
-
428
-
429
-
430
-
431
-
432
-
433
-
434
-
435
-
436
-
437
-
438
-
439
-
440
-
441
-
442
-
443
-
444
-
445
-
446
-
447
-
448
-
449
-
450
-
451
-
452
-
453
-
454
-
455
-
456
-
457
-
458
-
459
-
460
-
461
-
462
-
463
-
464
-
465
-
466
-
467
-
468
-
469
-
470
-
471
-
472
-
473
-
474
-
475
-
476
-
477
-
478
-
479
-
480
-
481
-
482
-
483
-
484
-
485
-
486
-
487
-
488
-
489
-
490
-
491
-
492
-
493
-
494
-
495
-
496
-
497
-
498
-
499
-
500
-
501
-
502
-
503
-
504
-
505
-
506
-
507
-
508
-
509
-
510
-
511
-
512
-
513
-
514
-
515
-
516
-
517
-
518
-
519
-
520
-
521
-
522
-
523
-
524
-
525
-
526
-
527
-
528
-
529
-
530
-
531
-
532
-
533
-
534
-
535
-
536
-
537
-
538
-
539
-
540
-
541
-
542
-
543
 |
 |

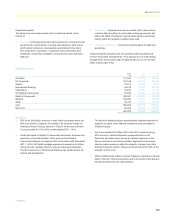
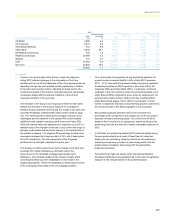
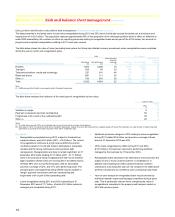
Credit risk mitigation continued
Wholesale market exposures
As set out in the table below, the Group receives collateral for reverse repurchase transactions and for derivatives, typically in the form of cash, quoted
debt securities or equities. The risks inherent in both types of transaction are further mitigated through master bilateral netting arrangements. Industry
standard documentation such as master repurchase agreements and credit support annexes accompanied by legal opinion, is used for financial
collateral taken as part of trading activities.
2012 2011 2010
£bn £bn £bn
Reverse repurchase agreements 104.8 100.9 95.1
Securities received as collateral (1) (104.7)(98.9)(94.3)
Derivative assets gross exposure 441.9 530.1 432.2
Counterparty netting (373.9)(441.6)(330.4)
Cash collateral held (34.1) (37.2) (31.1)
Securities received as collateral (5.6)(5.3)(2.9)
Note:
(1) In accordance with normal market practice, at 31 December 2012 £100.7 billion (2011 - £95.4 billion; 2010 - £93.5 billion) had been resold or re-pledged as collateral for the Group’s own transactions.
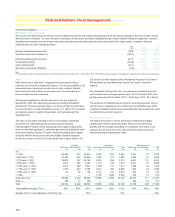
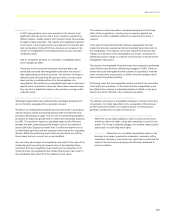
Retail
Within the Group’s retail book, mortgage and home equity lending
portfolios are secured by residential property. The Group’s portfolio of US
automobile loans is secured by motor cars or other vehicles. Student
loans and credit card lending are all unsecured. The vast majority of
personal loans are also unsecured.
All borrowing applications, whether secured or not, are subject to
appropriate credit risk underwriting processes including affordability
assessment. Pricing is typically higher on unsecured than secured loans.
For secured loans, pricing will typically vary by LTV. Higher LTV products
are typically subject to higher interest rates commensurate with the
associated risk.
The value of a property intended to secure a mortgage is assessed
during the loan underwriting process using industry-standard
methodologies. Property values supporting home equity lending reflect
either an individual appraisal or valuations generated by statistically valid
automated valuation models. Property values are updated each quarter
using the relevant house price index (the Halifax Quarterly Regional
House Price Index in the UK, the Case-Shiller Home Value Index in the
US, and the Central Statistics Office Residential Property Price Index in
ROI (monthly) and the Nationwide House Price Index in Northern
Ireland).
For automobile lending in the US, new vehicles are valued at cost and
used vehicles at the average trade-in value. At 31 December 2012, this
portfolio amounted to £5.4 billion (2011 - £4.8 billion; 2010 - £5.1 billion).
The existence of collateral has an impact on provisioning levels. Once a
secured loan is classified as non-performing, the realisable value of the
underlying collateral and the costs associated with repossession are used
to estimate the provision required.
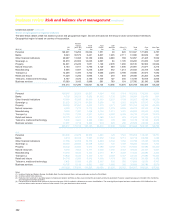
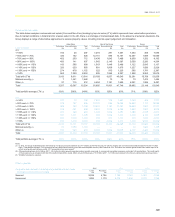
Residential mortgages
The table below shows LTVs for the Group’s residential mortgage
portfolio split between performing (AQ1-AQ9) and non-performing
(AQ10), with the average calculated on a weighted value basis. Loan
balances are as at the end of the year whereas property values are
calculated using the appropriate index.
UK Retail Ulster Bank RBS Citizens (1)
Loan-to-value Performing
£m
Non-performing
£m
Total
£m
Performing
£m
Non-performing
£m
Total
£m
Performing
£m
Non-performing
£m
Total
£m
2012
<= 50% 22,306 327 22,633 2,182274 2,456 4,167 51 4,218
> 50% and <= 70% 27,408 457 27,865 1,635 197 1,832 4,806 76 4,882
> 70% and <= 90% 34,002 767 34,769 2,019294 2,313 6,461 114 6,575
> 90% and <= 100% 7,073 366 7,439 1,119156 1,275 2,011 57 2,068
> 100% and <= 110% 3,301 290 3,591 1,239 174 1,413 1,280 43 1,323
> 110% and <= 130% 1,919 239 2,158 2,412 397 2,809 1,263 42 1,305
> 130% and <= 150% 83 26 109 2,144 474 2,618 463 14 477
> 150% — — — 3,156 1,290 4,446 365 14 379
Total with LTVs 96,092 2,472 98,564 15,9063,256 19,162 20,816 411 21,227
Other (2) 486 12 498 — — — 292 19 311
Total 96,578 2,484 99,062 15,9063,256 19,162 21,108 430 21,538
Total portfolio average LTV (3) 66% 80% 67% 108% 132% 112% 75% 86% 75%
Average LTV on new originations during the year 65% 74% 64%
170
Business review Risk and balance sheet management continued