RBS 2012 Annual Report Download - page 50
Download and view the complete annual report
Please find page 50 of the 2012 RBS annual report below. You can navigate through the pages in the report by either clicking on the pages listed below, or by using the keyword search tool below to find specific information within the annual report.-
 1
1 -
2
-
3
-
4
-
5
-
6
-
7
-
8
-
9
-
10
-
11
-
12
-
13
-
14
-
15
-
16
-
17
-
18
-
19
-
20
-
21
-
22
-
23
-
24
-
25
-
26
-
27
-
28
-
29
-
30
-
31
-
32
-
33
-
34
-
35
-
36
-
37
-
38
-
39
-
 40
40 -
 41
41 -
 42
42 -
 43
43 -
 44
44 -
 45
45 -
 46
46 -
 47
47 -
 48
48 -
 49
49 -
 50
50 -
 51
51 -
 52
52 -
 53
53 -
 54
54 -
 55
55 -
 56
56 -
 57
57 -
 58
58 -
 59
59 -
 60
60 -
61
-
62
-
63
-
64
-
65
-
66
-
67
-
68
-
69
-
70
-
71
-
72
-
73
-
74
-
75
-
76
-
77
-
78
-
79
-
80
-
81
-
82
-
83
-
84
-
85
-
86
-
87
-
88
-
89
-
90
-
91
-
92
-
93
-
94
-
95
-
96
-
97
-
98
-
99
-
100
-
101
-
102
-
103
-
104
-
105
-
106
-
107
-
108
-
109
-
110
-
111
-
112
-
113
-
114
-
115
-
116
-
117
-
118
-
119
-
120
-
121
-
122
-
123
-
124
-
125
-
126
-
127
-
128
-
129
-
130
-
131
-
132
-
133
-
134
-
135
-
136
-
137
-
138
-
139
-
140
-
141
-
142
-
143
-
144
-
145
-
146
-
147
-
148
-
149
-
150
-
151
-
152
-
153
-
154
-
155
-
156
-
157
-
158
-
159
-
160
-
161
-
162
-
163
-
164
-
165
-
166
-
167
-
168
-
169
-
170
-
171
-
172
-
173
-
174
-
175
-
176
-
177
-
178
-
179
-
180
-
181
-
182
-
183
-
184
-
185
-
186
-
187
-
188
-
189
-
190
-
191
-
192
-
193
-
194
-
195
-
196
-
197
-
198
-
199
-
200
-
201
-
202
-
203
-
204
-
205
-
206
-
207
-
208
-
209
-
210
-
211
-
212
-
213
-
214
-
215
-
216
-
217
-
218
-
219
-
220
-
221
-
222
-
223
-
224
-
225
-
226
-
227
-
228
-
229
-
230
-
231
-
232
-
233
-
234
-
235
-
236
-
237
-
238
-
239
-
240
-
241
-
242
-
243
-
244
-
245
-
246
-
247
-
248
-
249
-
250
-
251
-
252
-
253
-
254
-
255
-
256
-
257
-
258
-
259
-
260
-
261
-
262
-
263
-
264
-
265
-
266
-
267
-
268
-
269
-
270
-
271
-
272
-
273
-
274
-
275
-
276
-
277
-
278
-
279
-
280
-
281
-
282
-
283
-
284
-
285
-
286
-
287
-
288
-
289
-
290
-
291
-
292
-
293
-
294
-
295
-
296
-
297
-
298
-
299
-
300
-
301
-
302
-
303
-
304
-
305
-
306
-
307
-
308
-
309
-
310
-
311
-
312
-
313
-
314
-
315
-
316
-
317
-
318
-
319
-
320
-
321
-
322
-
323
-
324
-
325
-
326
-
327
-
328
-
329
-
330
-
331
-
332
-
333
-
334
-
335
-
336
-
337
-
338
-
339
-
340
-
341
-
342
-
343
-
344
-
345
-
346
-
347
-
348
-
349
-
350
-
351
-
352
-
353
-
354
-
355
-
356
-
357
-
358
-
359
-
360
-
361
-
362
-
363
-
364
-
365
-
366
-
367
-
368
-
369
-
370
-
371
-
372
-
373
-
374
-
375
-
376
-
377
-
378
-
379
-
380
-
381
-
382
-
383
-
384
-
385
-
386
-
387
-
388
-
389
-
390
-
391
-
392
-
393
-
394
-
395
-
396
-
397
-
398
-
399
-
400
-
401
-
402
-
403
-
404
-
405
-
406
-
407
-
408
-
409
-
410
-
411
-
412
-
413
-
414
-
415
-
416
-
417
-
418
-
419
-
420
-
421
-
422
-
423
-
424
-
425
-
426
-
427
-
428
-
429
-
430
-
431
-
432
-
433
-
434
-
435
-
436
-
437
-
438
-
439
-
440
-
441
-
442
-
443
-
444
-
445
-
446
-
447
-
448
-
449
-
450
-
451
-
452
-
453
-
454
-
455
-
456
-
457
-
458
-
459
-
460
-
461
-
462
-
463
-
464
-
465
-
466
-
467
-
468
-
469
-
470
-
471
-
472
-
473
-
474
-
475
-
476
-
477
-
478
-
479
-
480
-
481
-
482
-
483
-
484
-
485
-
486
-
487
-
488
-
489
-
490
-
491
-
492
-
493
-
494
-
495
-
496
-
497
-
498
-
499
-
500
-
501
-
502
-
503
-
504
-
505
-
506
-
507
-
508
-
509
-
510
-
511
-
512
-
513
-
514
-
515
-
516
-
517
-
518
-
519
-
520
-
521
-
522
-
523
-
524
-
525
-
526
-
527
-
528
-
529
-
530
-
531
-
532
-
533
-
534
-
535
-
536
-
537
-
538
-
539
-
540
-
541
-
542
-
543
 |
 |

48
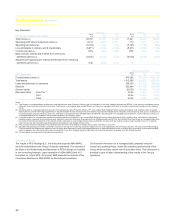
Business review continued
Results summary continued
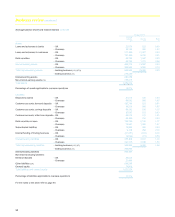
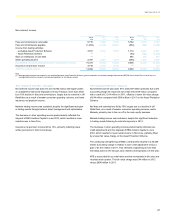
Operating expenses
Operating expenses increased to £17,827 million from £17,134 million in
2011. This included PPI costs of £1,110 million (2011 - £850 million),
IRHP redress and related costs of £700 million, regulatory fines of £381
million, integration and restructuring costs of £1,415 million compared
with £1,016 million in 2011, and write-down of goodwill and other
intangible assets of £124 million, principally as a result of exits from
selective countries and lower revenue projections by Markets. Excluding
these items, operating expenses were down 8% driven by cost savings
achieved as a result of the cost reduction programme.
Impairment losses
Impairment losses were £5,279 million, compared with £8,707 million in
2011.
Risk elements in lending represented 9.1% of gross loans and advances
to customers excluding reverse repos at 31 December 2012 (2011 -
8.6%).
Provision coverage of risk elements in lending was 52% (2011 - 49%).
Tax
The tax charge for 2012 was £469 million (2011 - £1,127 million).
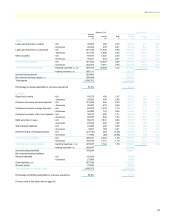
Loss per share
Basic loss per ordinary and B share from continuing operations was
53.7p per share compared with 21.3p per share in 2011.
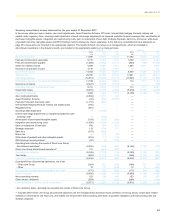
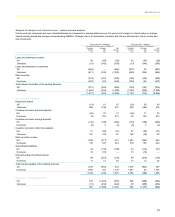
2011 compared with 2010 - managed
Operating profit
Group operating profit, excluding own credit adjustments, Asset
Protection Scheme, PPI costs, sovereign debt impairment, interest rate
hedge adjustments on impaired available-for-sale sovereign debt,
amortisation of purchased intangible assets, integration and restructuring
costs, gain on redemption of own debt, strategic disposals, bank levy,
bonus tax, write-down of goodwill and other intangible assets and RFS
holdings minority interest was £1,824 million compared with £1,845
million in 2010. Adjusting for the impact of the disposal of GMS in 2010,
which recorded an operating profit of £207 million, Group operating profit
was up 11%. The improvement was driven by a strong Retail &
Commercial (R&C) operating performance and the return to profit of
Direct Line Group. Ulster Bank and Markets faced more difficult
conditions, leaving total Core operating profit at £6,045 million. Non-Core
operating loss in 2011 was 26% lower compared with 2010, despite the
acceleration of disposals in the second half of the year.
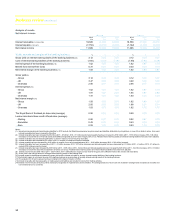
Total income
Total income, excluding own credit adjustments, Asset Protection
Scheme, gain on redemption of own debt, strategic disposals and RFS
MI, fell by 15% to £27,709 million, primarily reflecting lower net interest
income, lower trading income in Markets and Non-Core and a fall in
insurance net premium income.
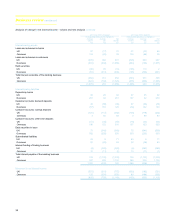
Net interest income
Group net interest income fell 11% to £12,689 million largely driven by
the run-off of balances and exit of higher margin, higher risk segments in
Non-Core. Group NIM was 9 basis points lower, reflecting the cost of
carrying a higher liquidity portfolio and by the impact of non-performing
assets in the Non-Core division. However, R&C NIM was up 6 basis
points, with strengthening asset margins in the first half of the year
offsetting the impact of a competitive deposit market.
Non-interest income
Non-interest income decreased by £3,374 million in 2011 principally
driven by lower trading income in Markets and Non-Core, and a fall in
insurance net premium income. Volatile market conditions led to a
reduction in Markets trading income, driven by the deterioration in global
credit markets as sovereign difficulties in the eurozone grew. Non-Core
trading losses increased by £690 million, reflecting costs incurred as part
of the division’s focus on reducing capital trading assets.
Operating expenses
Total operating expenses, excluding PPI costs, amortisation of purchased
intangible assets, integration and restructuring costs, bank levy, bonus
tax, write-down of goodwill and other intangible assets and RFS MI, fell
by 7% to £15,478 million, driven by cost savings achieved as a result of
the cost reduction programme and Non-Core run-off, largely reflecting the
disposal of RBS Sempra and specific country exits. Staff costs fell 9%,
driven by lower Markets and International Banking variable compensation
as a result of its decrease in revenues, and in Non-Core, given the impact
of a 32% reduction in headcount and continued business disposals and
country exits. The Group cost: income ratio was 63% in 2011 compared
with 60% in 2010.
Insurance net claims
General insurance claims were £1,730 million lower, mainly due to the
non-repeat of bodily injury reserve strengthening in 2010, de-risking of
the motor book, more benign weather in 2011 and claims in Non-Core
decreasing as legacy policies ran-off.
Impairment losses
Impairment losses fell to £7,439 million from £9,256 million in 2010, with
Core impairments falling by £260 million and Non-Core by £1,557 million,
despite continuing challenges in Ulster Bank and corporate real estate
portfolios.
Impairments represented 1.5% of gross loans and advances excluding
reverse repos compared with 1.7% in 2010.
Risk elements in lending at 31 December 2011 represented 8.6% of
loans and advances excluding reverse repos, compared with 7.3% a year
earlier. Provision coverage was 49%, compared with 47% at 31
December 2010.