RBS 2012 Annual Report Download - page 425
Download and view the complete annual report
Please find page 425 of the 2012 RBS annual report below. You can navigate through the pages in the report by either clicking on the pages listed below, or by using the keyword search tool below to find specific information within the annual report.-
 1
1 -
2
-
3
-
4
-
5
-
6
-
7
-
8
-
9
-
10
-
11
-
12
-
13
-
14
-
15
-
16
-
17
-
18
-
19
-
20
-
21
-
22
-
23
-
24
-
25
-
26
-
27
-
28
-
29
-
30
-
31
-
32
-
33
-
34
-
35
-
36
-
37
-
38
-
39
-
40
-
41
-
42
-
43
-
44
-
45
-
46
-
47
-
48
-
49
-
50
-
51
-
52
-
53
-
54
-
55
-
56
-
57
-
58
-
59
-
60
-
61
-
62
-
63
-
64
-
65
-
66
-
67
-
68
-
69
-
70
-
71
-
72
-
73
-
74
-
75
-
76
-
77
-
78
-
79
-
80
-
81
-
82
-
83
-
84
-
85
-
86
-
87
-
88
-
89
-
90
-
91
-
92
-
93
-
94
-
95
-
96
-
97
-
98
-
99
-
100
-
101
-
102
-
103
-
104
-
105
-
106
-
107
-
108
-
109
-
110
-
111
-
112
-
113
-
114
-
115
-
116
-
117
-
118
-
119
-
120
-
121
-
122
-
123
-
124
-
125
-
126
-
127
-
128
-
129
-
130
-
131
-
132
-
133
-
134
-
135
-
136
-
137
-
138
-
139
-
140
-
141
-
142
-
143
-
144
-
145
-
146
-
147
-
148
-
149
-
150
-
151
-
152
-
153
-
154
-
155
-
156
-
157
-
158
-
159
-
160
-
161
-
162
-
163
-
164
-
165
-
166
-
167
-
168
-
169
-
170
-
171
-
172
-
173
-
174
-
175
-
176
-
177
-
178
-
179
-
180
-
181
-
182
-
183
-
184
-
185
-
186
-
187
-
188
-
189
-
190
-
191
-
192
-
193
-
194
-
195
-
196
-
197
-
198
-
199
-
200
-
201
-
202
-
203
-
204
-
205
-
206
-
207
-
208
-
209
-
210
-
211
-
212
-
213
-
214
-
215
-
216
-
217
-
218
-
219
-
220
-
221
-
222
-
223
-
224
-
225
-
226
-
227
-
228
-
229
-
230
-
231
-
232
-
233
-
234
-
235
-
236
-
237
-
238
-
239
-
240
-
241
-
242
-
243
-
244
-
245
-
246
-
247
-
248
-
249
-
250
-
251
-
252
-
253
-
254
-
255
-
256
-
257
-
258
-
259
-
260
-
261
-
262
-
263
-
264
-
265
-
266
-
267
-
268
-
269
-
270
-
271
-
272
-
273
-
274
-
275
-
276
-
277
-
278
-
279
-
280
-
281
-
282
-
283
-
284
-
285
-
286
-
287
-
288
-
289
-
290
-
291
-
292
-
293
-
294
-
295
-
296
-
297
-
298
-
299
-
300
-
301
-
302
-
303
-
304
-
305
-
306
-
307
-
308
-
309
-
310
-
311
-
312
-
313
-
314
-
315
-
316
-
317
-
318
-
319
-
320
-
321
-
322
-
323
-
324
-
325
-
326
-
327
-
328
-
329
-
330
-
331
-
332
-
333
-
334
-
335
-
336
-
337
-
338
-
339
-
340
-
341
-
342
-
343
-
344
-
345
-
346
-
347
-
348
-
349
-
350
-
351
-
352
-
353
-
354
-
355
-
356
-
357
-
358
-
359
-
360
-
361
-
362
-
363
-
364
-
365
-
366
-
367
-
368
-
369
-
370
-
371
-
372
-
373
-
374
-
375
-
376
-
377
-
378
-
379
-
380
-
381
-
382
-
383
-
384
-
385
-
386
-
387
-
388
-
389
-
390
-
391
-
392
-
393
-
394
-
395
-
396
-
397
-
398
-
399
-
400
-
401
-
402
-
403
-
404
-
405
-
406
-
407
-
408
-
409
-
410
-
411
-
412
-
413
-
414
-
 415
415 -
 416
416 -
 417
417 -
 418
418 -
 419
419 -
 420
420 -
 421
421 -
 422
422 -
 423
423 -
 424
424 -
 425
425 -
 426
426 -
 427
427 -
 428
428 -
 429
429 -
 430
430 -
 431
431 -
 432
432 -
 433
433 -
 434
434 -
 435
435 -
436
-
437
-
438
-
439
-
440
-
441
-
442
-
443
-
444
-
445
-
446
-
447
-
448
-
449
-
450
-
451
-
452
-
453
-
454
-
455
-
456
-
457
-
458
-
459
-
460
-
461
-
462
-
463
-
464
-
465
-
466
-
467
-
468
-
469
-
470
-
471
-
472
-
473
-
474
-
475
-
476
-
477
-
478
-
479
-
480
-
481
-
482
-
483
-
484
-
485
-
486
-
487
-
488
-
489
-
490
-
491
-
492
-
493
-
494
-
495
-
496
-
497
-
498
-
499
-
500
-
501
-
502
-
503
-
504
-
505
-
506
-
507
-
508
-
509
-
510
-
511
-
512
-
513
-
514
-
515
-
516
-
517
-
518
-
519
-
520
-
521
-
522
-
523
-
524
-
525
-
526
-
527
-
528
-
529
-
530
-
531
-
532
-
533
-
534
-
535
-
536
-
537
-
538
-
539
-
540
-
541
-
542
-
543
 |
 |

RBS GROUP 2012
423
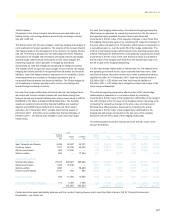
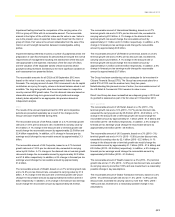
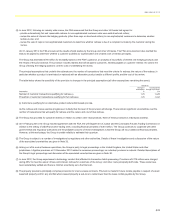
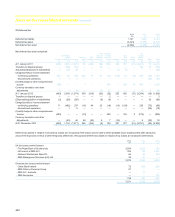
Impairment testing involves the comparison of the carrying value of a
CGU or group of CGUs with its recoverable amount. The recoverable
amount is the higher of the unit's fair value and its value in use. Value in
use is the present value of expected future cash flows from the CGU or
group of CGUs. Fair value is the amount obtainable from the sale of the
CGU in an arm's length transaction between knowledgeable, willing
parties.
Impairment testing inherently involves a number of judgmental areas: the
preparation of cash flow forecasts for periods that are beyond the normal
requirements of management reporting; the assessment of the discount
rate appropriate to the business; estimation of the fair value of CGUs;
and the valuation of the separable assets of each business whose
goodwill is being reviewed. Sensitivity to the more significant variables in
each assessment are presented below.
The recoverable amounts for all CGUs at 30 September 2012 were
based on the value in use test, using management's latest five-year
forecasts. The carrying amount of each CGU is assumed to be its capital
contribution as a proxy for equity, where a divisional balance sheet is not
available. The long-term growth rates have been based on respective
country nominal GDP growth rates. The risk discount rates are based on
observable market long-term government bond yields and average
industry betas adjusted for an appropriate risk premium based on
independent analysis.
2012
The results of the annual impairment test for 2012 and comparative
periods are presented separately as a result of the changes to the
Group’s structure implemented during 2012.
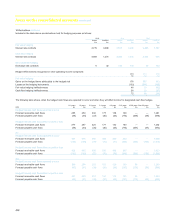
The recoverable amount of UK Retail, based on a 4.7% terminal growth
rate and a 13.5% pre tax discount rate, exceeded its carrying value by
£13.8 billion. A 1% change in the discount rate or terminal growth rate
would change the recoverable amount by approximately £2.5 billion and
£2.4 billion respectively. In addition, a 5% change in forecast pre tax
earnings would change the recoverable amount by approximately £1.3
billion.
The recoverable amount of UK Corporate, based on a 4.7% terminal
growth rate and a 13.5% pre tax discount rate, exceeded its carrying
value by £6.3 billion. A 1% change in the discount rate or terminal growth
rate would change the recoverable amount by approximately £2.3 billion
and £1.8 billion respectively. In addition, a 5% change in forecast pre tax
earnings would change the recoverable amount by approximately
£1.4 billion.
The recoverable amount of Wealth, based on a 4.7% terminal growth rate
and a 14.8% pre tax discount rate, exceeded its carrying value by £1.9
billion. A 1% change in the discount rate or terminal growth rate would
change the recoverable amount by approximately £0.5 billion and £0.4
billion respectively. In addition, a 5% change in forecast pre tax earnings
would change the recoverable amount by approximately £0.3 billion.
The recoverable amount of International Banking, based on a 4.7%
terminal growth rate and a 12.2% pre tax discount rate, exceeded its
carrying value by £0.3 billion. A 1% change in the discount rate or
terminal growth rate would change the recoverable amount by
approximately £1.1 billion and £1.2 billion respectively. In addition, a 5%
change in forecast pre tax earnings would change the recoverable
amount by approximately £0.6 billion.
The recoverable amount of US Retail & Commercial, based on a 5.3%
terminal growth rate and a 16.9% pre tax discount rate, exceeded its
carrying value by £2.0 billion. A 1% change in the discount rate or
terminal growth rate would change the recoverable amount by
approximately £1.2 billion and £0.8 billion respectively. In addition, a 5%
change in forecast pre tax earnings would change the recoverable
amount by approximately £0.7 billion.
The Group has been considering various strategies for its investment in
Citizens Financial Group (CFG). The Group has announced plans for a
partial IPO of CFG over the medium term, likely two years.
Notwithstanding this planned course of action, the recoverable amount of
the US Retail & Commercial CGU remains its value in use.
Direct Line Group has been reclassified as a disposal group in 2012 and
its goodwill is assessed as part of its fair value at 31 December 2012.
2011 and 2010
The recoverable amount of UK Retail, based on a 3% (2010 - 3%)
terminal growth rate and a 14% (2010 - 15.7%) pre tax discount rate,
exceeded the carrying amount by £5.5 billion (2010 - £6.9 billion). A 1%
change in the discount rate or terminal growth rate would change the
recoverable amount by approximately £1.1 billion (2010 - £1.5 billion) and
£0.6 billion (2010 - £0.9 billion) respectively. In addition, a 5% change in
forecast pre tax earnings would change the recoverable amount by
approximately £0.8 billion (2010 - £0.9 billion).
The recoverable amount of UK Corporate, based on a 3% (2010 - 3%)
terminal growth rate and a 14.1% (2010 - 15.6%) pre tax discount rate,
exceeded its carrying value by £2.1 billion (2010 - £5.3 billion). A 1%
change in the discount rate or terminal growth rate would change the
recoverable amount by approximately £1.1 billion (2010 - £1.6 billion) and
£0.5 billion (2010 - £0.9 billion) respectively. In addition, a 5% change in
forecast pre tax earnings would change the recoverable amount by
approximately £0.8 billion (2010 - £1.0 billion).
The recoverable amount of Wealth, based on a 3% (2010 - 3%) terminal
growth rate and an 11.0% (2010 - 12.0%) pre tax discount rate, exceeded
its carrying value by more than 100% and was insensitive to a reasonably
possible change in key assumptions.
The recoverable amount of Global Transaction Services, based on a 3%
(2010 - 3%) terminal growth rate and an 11.4% (2010 - 12.8%) pre tax
discount rate, exceeded its carrying value by more than 100% (2010 -
100%) and was insensitive to a reasonably possible change in key
assumptions.