RBS 2012 Annual Report Download - page 71
Download and view the complete annual report
Please find page 71 of the 2012 RBS annual report below. You can navigate through the pages in the report by either clicking on the pages listed below, or by using the keyword search tool below to find specific information within the annual report.-
 1
1 -
2
-
3
-
4
-
5
-
6
-
7
-
8
-
9
-
10
-
11
-
12
-
13
-
14
-
15
-
16
-
17
-
18
-
19
-
20
-
21
-
22
-
23
-
24
-
25
-
26
-
27
-
28
-
29
-
30
-
31
-
32
-
33
-
34
-
35
-
36
-
37
-
38
-
39
-
40
-
41
-
42
-
43
-
44
-
45
-
46
-
47
-
48
-
49
-
50
-
51
-
52
-
53
-
54
-
55
-
56
-
57
-
58
-
59
-
60
-
 61
61 -
 62
62 -
 63
63 -
 64
64 -
 65
65 -
 66
66 -
 67
67 -
 68
68 -
 69
69 -
 70
70 -
 71
71 -
 72
72 -
 73
73 -
 74
74 -
 75
75 -
 76
76 -
 77
77 -
 78
78 -
 79
79 -
 80
80 -
 81
81 -
82
-
83
-
84
-
85
-
86
-
87
-
88
-
89
-
90
-
91
-
92
-
93
-
94
-
95
-
96
-
97
-
98
-
99
-
100
-
101
-
102
-
103
-
104
-
105
-
106
-
107
-
108
-
109
-
110
-
111
-
112
-
113
-
114
-
115
-
116
-
117
-
118
-
119
-
120
-
121
-
122
-
123
-
124
-
125
-
126
-
127
-
128
-
129
-
130
-
131
-
132
-
133
-
134
-
135
-
136
-
137
-
138
-
139
-
140
-
141
-
142
-
143
-
144
-
145
-
146
-
147
-
148
-
149
-
150
-
151
-
152
-
153
-
154
-
155
-
156
-
157
-
158
-
159
-
160
-
161
-
162
-
163
-
164
-
165
-
166
-
167
-
168
-
169
-
170
-
171
-
172
-
173
-
174
-
175
-
176
-
177
-
178
-
179
-
180
-
181
-
182
-
183
-
184
-
185
-
186
-
187
-
188
-
189
-
190
-
191
-
192
-
193
-
194
-
195
-
196
-
197
-
198
-
199
-
200
-
201
-
202
-
203
-
204
-
205
-
206
-
207
-
208
-
209
-
210
-
211
-
212
-
213
-
214
-
215
-
216
-
217
-
218
-
219
-
220
-
221
-
222
-
223
-
224
-
225
-
226
-
227
-
228
-
229
-
230
-
231
-
232
-
233
-
234
-
235
-
236
-
237
-
238
-
239
-
240
-
241
-
242
-
243
-
244
-
245
-
246
-
247
-
248
-
249
-
250
-
251
-
252
-
253
-
254
-
255
-
256
-
257
-
258
-
259
-
260
-
261
-
262
-
263
-
264
-
265
-
266
-
267
-
268
-
269
-
270
-
271
-
272
-
273
-
274
-
275
-
276
-
277
-
278
-
279
-
280
-
281
-
282
-
283
-
284
-
285
-
286
-
287
-
288
-
289
-
290
-
291
-
292
-
293
-
294
-
295
-
296
-
297
-
298
-
299
-
300
-
301
-
302
-
303
-
304
-
305
-
306
-
307
-
308
-
309
-
310
-
311
-
312
-
313
-
314
-
315
-
316
-
317
-
318
-
319
-
320
-
321
-
322
-
323
-
324
-
325
-
326
-
327
-
328
-
329
-
330
-
331
-
332
-
333
-
334
-
335
-
336
-
337
-
338
-
339
-
340
-
341
-
342
-
343
-
344
-
345
-
346
-
347
-
348
-
349
-
350
-
351
-
352
-
353
-
354
-
355
-
356
-
357
-
358
-
359
-
360
-
361
-
362
-
363
-
364
-
365
-
366
-
367
-
368
-
369
-
370
-
371
-
372
-
373
-
374
-
375
-
376
-
377
-
378
-
379
-
380
-
381
-
382
-
383
-
384
-
385
-
386
-
387
-
388
-
389
-
390
-
391
-
392
-
393
-
394
-
395
-
396
-
397
-
398
-
399
-
400
-
401
-
402
-
403
-
404
-
405
-
406
-
407
-
408
-
409
-
410
-
411
-
412
-
413
-
414
-
415
-
416
-
417
-
418
-
419
-
420
-
421
-
422
-
423
-
424
-
425
-
426
-
427
-
428
-
429
-
430
-
431
-
432
-
433
-
434
-
435
-
436
-
437
-
438
-
439
-
440
-
441
-
442
-
443
-
444
-
445
-
446
-
447
-
448
-
449
-
450
-
451
-
452
-
453
-
454
-
455
-
456
-
457
-
458
-
459
-
460
-
461
-
462
-
463
-
464
-
465
-
466
-
467
-
468
-
469
-
470
-
471
-
472
-
473
-
474
-
475
-
476
-
477
-
478
-
479
-
480
-
481
-
482
-
483
-
484
-
485
-
486
-
487
-
488
-
489
-
490
-
491
-
492
-
493
-
494
-
495
-
496
-
497
-
498
-
499
-
500
-
501
-
502
-
503
-
504
-
505
-
506
-
507
-
508
-
509
-
510
-
511
-
512
-
513
-
514
-
515
-
516
-
517
-
518
-
519
-
520
-
521
-
522
-
523
-
524
-
525
-
526
-
527
-
528
-
529
-
530
-
531
-
532
-
533
-
534
-
535
-
536
-
537
-
538
-
539
-
540
-
541
-
542
-
543
 |
 |

RBS GROUP 2012
69
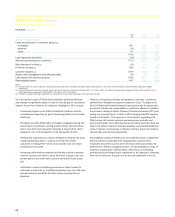
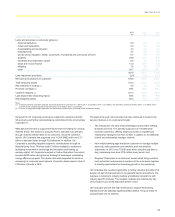
2012 compared with 2011
Operating profit fell by 6% as a 10% decline in income was only partly
offset by lower costs, down 6%, and improved impairment losses, down
33%.
Mortgage balances grew by £4.1 billion with the share of new business at
10%, ahead of our stock level of 8%. Growth as a result of FLS was
starting to appear by the end of the year as mortgage applications moved
through the pipeline to completion. Deposit growth of 6% was in line with
the market and drove a 300 basis point improvement in the loan:deposit
ratio to 103%.
Net interest income was down 7% due to weaker deposit margins and
reduction in unsecured balances, partly offset by mortgage growth.
Unsecured balances now represent 13% of total loans and advances to
customers compared with 23% in 2008, following realignment of risk
appetite and strong mortgage growth. Net interest margin declined as a
result of lower rates on current account hedges and increased
competition on savings rates in the early part of the year, partly offset by
widening asset margins.
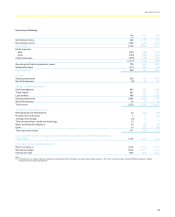
Non-interest income was 19% lower mainly due to:
x lower unauthorised overdraft fees as we continue to help customers
manage their finances by providing mobile text alerts and further
improving mobile banking functionality;
x weak consumer confidence lowering spending and associated fees
on cards; and
x lower investment income as a result of weak customer demand and
less advisor availability due to restructuring and retraining in
preparation for regulatory changes in 2013.
Costs were down £150 million, 6%, driven by the ongoing simplification of
processes across the business, lower headcount and lower FSCS levy.
Impairment losses were £259 million or 33% lower, reflecting the
continued benefit of risk appetite tightening in prior years and also a
smaller unsecured loan book. Impairments as a percentage of loans and
advances were 50 basis points versus 70 basis points in 2011.
Risk-weighted assets continued to improve over the year as the portfolio
mix adjusted, with increases in lower-risk secured mortgages, decreases
in unsecured lending and further quality improvements across the book.
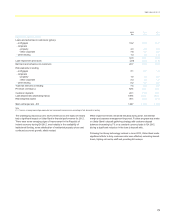
2011 compared with 2010
UK Retail delivered strong full year results, as operating profit increased
by £673 million to £2,021 million, despite continued uncertainty in the
economic climate and the low interest rate environment. Profit before
impairment losses was up £301 million or 12%, while impairments fell by
£372 million, with further improvements in the unsecured book and
continued careful mortgage underwriting. Return on equity improved to
24.5%.
The division continued to focus on growing secured lending while at the
same time building customer deposits, thereby reducing the Group’s
reliance on wholesale funding. Loans and advances to customers grew
2%, with a change in mix from unsecured to secured as the Group
actively sought to improve its risk profile. Mortgage balances grew by 5%,
while unsecured lending contracted by 11%.
x Mortgage growth reflected continued strong new business levels.
Gross mortgage lending market share of 10% continues above our
stock position of 8%.
x Customer deposits grew 6%, outperforming the market total deposit
growth of 3%. Savings balances grew by £6 billion, or 9%, with 1.5
million accounts opened, demonstrating the strength of our
customer franchise and our strategy to further develop primary
banking relationships.
Net interest income increased by 6% to £4,302 million, driven by strong
balance sheet growth. Net interest margin increased 6 basis points
recovering asset margins more than offset by more competitive savings
rates and lower long term swap rate returns adversely impacting liability
margins.
Non-interest income declined 10% to £1,206 million, primarily driven by
lower investment and protection income as a result of the dissolution of
the bancassurance joint venture. In addition, a number of changes have
been made to support delivery of Helpful Banking, such as ‘Act Now’ text
alerts, which have decreased fee income.
Overall expenses decreased by 6%. Cost reductions were driven by a
clear management focus on process re-engineering and operational
efficiency together with benefits from the dissolution of the
bancassurance joint venture, partly offset by higher inflation rates in utility
and mail costs.
Impairment losses decreased 32% to £788 million reflecting the impact of
a strengthened risk appetite, and a more stable economic environment.
Risk-weighted assets were broadly stable, with volume growth in lower
risk secured mortgages more than offset by a decrease in the unsecured
portfolio.