RBS 2012 Annual Report Download - page 48
Download and view the complete annual report
Please find page 48 of the 2012 RBS annual report below. You can navigate through the pages in the report by either clicking on the pages listed below, or by using the keyword search tool below to find specific information within the annual report.-
 1
1 -
2
-
3
-
4
-
5
-
6
-
7
-
8
-
9
-
10
-
11
-
12
-
13
-
14
-
15
-
16
-
17
-
18
-
19
-
20
-
21
-
22
-
23
-
24
-
25
-
26
-
27
-
28
-
29
-
30
-
31
-
32
-
33
-
34
-
35
-
36
-
37
-
 38
38 -
 39
39 -
 40
40 -
 41
41 -
 42
42 -
 43
43 -
 44
44 -
 45
45 -
 46
46 -
 47
47 -
 48
48 -
 49
49 -
 50
50 -
 51
51 -
 52
52 -
 53
53 -
 54
54 -
 55
55 -
 56
56 -
 57
57 -
 58
58 -
59
-
60
-
61
-
62
-
63
-
64
-
65
-
66
-
67
-
68
-
69
-
70
-
71
-
72
-
73
-
74
-
75
-
76
-
77
-
78
-
79
-
80
-
81
-
82
-
83
-
84
-
85
-
86
-
87
-
88
-
89
-
90
-
91
-
92
-
93
-
94
-
95
-
96
-
97
-
98
-
99
-
100
-
101
-
102
-
103
-
104
-
105
-
106
-
107
-
108
-
109
-
110
-
111
-
112
-
113
-
114
-
115
-
116
-
117
-
118
-
119
-
120
-
121
-
122
-
123
-
124
-
125
-
126
-
127
-
128
-
129
-
130
-
131
-
132
-
133
-
134
-
135
-
136
-
137
-
138
-
139
-
140
-
141
-
142
-
143
-
144
-
145
-
146
-
147
-
148
-
149
-
150
-
151
-
152
-
153
-
154
-
155
-
156
-
157
-
158
-
159
-
160
-
161
-
162
-
163
-
164
-
165
-
166
-
167
-
168
-
169
-
170
-
171
-
172
-
173
-
174
-
175
-
176
-
177
-
178
-
179
-
180
-
181
-
182
-
183
-
184
-
185
-
186
-
187
-
188
-
189
-
190
-
191
-
192
-
193
-
194
-
195
-
196
-
197
-
198
-
199
-
200
-
201
-
202
-
203
-
204
-
205
-
206
-
207
-
208
-
209
-
210
-
211
-
212
-
213
-
214
-
215
-
216
-
217
-
218
-
219
-
220
-
221
-
222
-
223
-
224
-
225
-
226
-
227
-
228
-
229
-
230
-
231
-
232
-
233
-
234
-
235
-
236
-
237
-
238
-
239
-
240
-
241
-
242
-
243
-
244
-
245
-
246
-
247
-
248
-
249
-
250
-
251
-
252
-
253
-
254
-
255
-
256
-
257
-
258
-
259
-
260
-
261
-
262
-
263
-
264
-
265
-
266
-
267
-
268
-
269
-
270
-
271
-
272
-
273
-
274
-
275
-
276
-
277
-
278
-
279
-
280
-
281
-
282
-
283
-
284
-
285
-
286
-
287
-
288
-
289
-
290
-
291
-
292
-
293
-
294
-
295
-
296
-
297
-
298
-
299
-
300
-
301
-
302
-
303
-
304
-
305
-
306
-
307
-
308
-
309
-
310
-
311
-
312
-
313
-
314
-
315
-
316
-
317
-
318
-
319
-
320
-
321
-
322
-
323
-
324
-
325
-
326
-
327
-
328
-
329
-
330
-
331
-
332
-
333
-
334
-
335
-
336
-
337
-
338
-
339
-
340
-
341
-
342
-
343
-
344
-
345
-
346
-
347
-
348
-
349
-
350
-
351
-
352
-
353
-
354
-
355
-
356
-
357
-
358
-
359
-
360
-
361
-
362
-
363
-
364
-
365
-
366
-
367
-
368
-
369
-
370
-
371
-
372
-
373
-
374
-
375
-
376
-
377
-
378
-
379
-
380
-
381
-
382
-
383
-
384
-
385
-
386
-
387
-
388
-
389
-
390
-
391
-
392
-
393
-
394
-
395
-
396
-
397
-
398
-
399
-
400
-
401
-
402
-
403
-
404
-
405
-
406
-
407
-
408
-
409
-
410
-
411
-
412
-
413
-
414
-
415
-
416
-
417
-
418
-
419
-
420
-
421
-
422
-
423
-
424
-
425
-
426
-
427
-
428
-
429
-
430
-
431
-
432
-
433
-
434
-
435
-
436
-
437
-
438
-
439
-
440
-
441
-
442
-
443
-
444
-
445
-
446
-
447
-
448
-
449
-
450
-
451
-
452
-
453
-
454
-
455
-
456
-
457
-
458
-
459
-
460
-
461
-
462
-
463
-
464
-
465
-
466
-
467
-
468
-
469
-
470
-
471
-
472
-
473
-
474
-
475
-
476
-
477
-
478
-
479
-
480
-
481
-
482
-
483
-
484
-
485
-
486
-
487
-
488
-
489
-
490
-
491
-
492
-
493
-
494
-
495
-
496
-
497
-
498
-
499
-
500
-
501
-
502
-
503
-
504
-
505
-
506
-
507
-
508
-
509
-
510
-
511
-
512
-
513
-
514
-
515
-
516
-
517
-
518
-
519
-
520
-
521
-
522
-
523
-
524
-
525
-
526
-
527
-
528
-
529
-
530
-
531
-
532
-
533
-
534
-
535
-
536
-
537
-
538
-
539
-
540
-
541
-
542
-
543
 |
 |

46
Business review continued
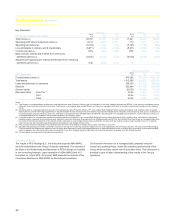
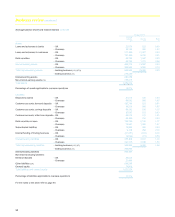
Summary consolidated income statement for the year ended 31 December 2012 continued
Managed Statutory
2012 2011 2010 2012 2011 2010
£m £m £m £m £m £m
Basic loss per ordinary and B share from continuing operations (1) (53.7p)(21.3p)(2.9p) (53.7p)(21.3p)(2.9p)
Own credit adjustments 32.5p (13.9p)(1.6p)
Asset Protection Scheme 0.3p 6.2p 10.6p
Payment Protection Insurance costs 7.8p 5.8p —
Interest Rate Hedging Products redress and related costs 4.9p — —
Regulatory fines 3.5p — —
Sovereign debt impairment — 10.2p —
Interest rate hedge adjustments on impaired available-for-sale
sovereign debt — 1.6p —
Amortisation of purchased intangible assets 1.2p 1.4p 2.4p
Integration and restructuring costs 11.3p 7.6p 7.5p
Gain on redemption of own debt (3.2p)(2.3p)(9.5p)
Strategic disposals (1.0p)0.8p (1.4p)
Bank levy 1.6p 2.8p —
Bonus tax — 0.2p 0.9p
Write-down of goodwill and other intangible assets 1.1p 0.1p 0.1p
Adjusted earnings/(loss) per ordinary and B share from continuing
operations 6.3p (0.8p)6.1p
Note:
(1) Prior year data have been adjusted for the sub-division and one-for-ten consolidation of ordinary shares, which took effect in June 2012.
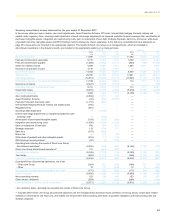
Results summary
2012 compared with 2011 - managed
Operating profit
Group operating profit, excluding own credit adjustments, Asset
Protection Scheme, Payment Protection Insurance (PPI) costs, Interest
Rate Hedging Products (IRHP) redress and related costs, regulatory
fines, sovereign debt impairment, interest rate hedge adjustments on
impaired available-for-sale sovereign debt, amortisation of purchased
intangible assets, integration and restructuring costs, gain on redemption
of own debt, strategic disposals, bank levy, bonus tax, write-down of
goodwill and other intangible assets and RFS MI, and includes the results
of Direct Line Group on a managed basis which are included in
discontinued operations in the statutory results, was £3,462 million
compared with £1,824 million in 2011. The improvement was driven by
lower costs in Markets, reflecting reduced headcount and lower levels of
variable compensation, and a better operating performance in Non-Core,
where losses fell by 32%. These improvements were partially offset by
weaker performance in Retail & Commercial, as economic conditions
remained difficult.
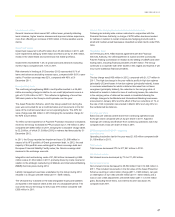
Total income
Total income, excluding own credit adjustments, Asset Protection
Scheme, gain on redemption of own debt, strategic disposals and RFS
MI, and including Direct Line Group on a managed basis, which is
included in discontinued operations in the statutory results, fell by 7% to
£25,787 million, primarily reflecting lower net interest income and a fall in
insurance net premium income.
Net interest income
Group net interest income declined by 8% to £11,695 million largely
reflecting lower interest-earning asset balances. Group net interest
margin (NIM), despite very low interest rates and strong deposit
competition, remained stable.
Non-interest income
Non-interest income decreased by £928 million in 2012 principally driven
by lower net fees and commissions and a fall in insurance net premium
income. Net fees and commissions fell largely due to weaker consumer
spending volumes in the UK together with legislation changes in the US.
Insurance net premium income was down primarily due to lower written
premiums in Direct Line Group.
Operating expenses
Total operating expenses, excluding Payment Protection Insurance costs,
Interest Rate Hedging Products redress and related costs, regulatory
fines, amortisation of purchased intangible assets, integration and
restructuring costs, bank levy, bonus tax, write-down of goodwill and
other intangible assets and RFS MI, and including Direct Line on a
managed basis, which is included in discontinued operations in the
statutory results, fell by 6% to £14,619 million, with staff costs down 6%
as headcount fell by 9,600 to 137,200. The decline in expenses was
largely driven by Non-Core run-down and lower variable compensation
(particularly in Markets), including variable compensation award
reductions and clawbacks following the settlements reached with UK and
US authorities in relation to attempts to manipulate LIBOR. The run-off of
discontinued businesses in Markets and International Banking, following
the restructuring announced in January 2012, and simplification of
processes and headcount reduction in UK Retail also yielded cost
benefits. Group cost: income ratio was flat at 63%.