RBS 2012 Annual Report Download - page 251
Download and view the complete annual report
Please find page 251 of the 2012 RBS annual report below. You can navigate through the pages in the report by either clicking on the pages listed below, or by using the keyword search tool below to find specific information within the annual report.-
 1
1 -
2
-
3
-
4
-
5
-
6
-
7
-
8
-
9
-
10
-
11
-
12
-
13
-
14
-
15
-
16
-
17
-
18
-
19
-
20
-
21
-
22
-
23
-
24
-
25
-
26
-
27
-
28
-
29
-
30
-
31
-
32
-
33
-
34
-
35
-
36
-
37
-
38
-
39
-
40
-
41
-
42
-
43
-
44
-
45
-
46
-
47
-
48
-
49
-
50
-
51
-
52
-
53
-
54
-
55
-
56
-
57
-
58
-
59
-
60
-
61
-
62
-
63
-
64
-
65
-
66
-
67
-
68
-
69
-
70
-
71
-
72
-
73
-
74
-
75
-
76
-
77
-
78
-
79
-
80
-
81
-
82
-
83
-
84
-
85
-
86
-
87
-
88
-
89
-
90
-
91
-
92
-
93
-
94
-
95
-
96
-
97
-
98
-
99
-
100
-
101
-
102
-
103
-
104
-
105
-
106
-
107
-
108
-
109
-
110
-
111
-
112
-
113
-
114
-
115
-
116
-
117
-
118
-
119
-
120
-
121
-
122
-
123
-
124
-
125
-
126
-
127
-
128
-
129
-
130
-
131
-
132
-
133
-
134
-
135
-
136
-
137
-
138
-
139
-
140
-
141
-
142
-
143
-
144
-
145
-
146
-
147
-
148
-
149
-
150
-
151
-
152
-
153
-
154
-
155
-
156
-
157
-
158
-
159
-
160
-
161
-
162
-
163
-
164
-
165
-
166
-
167
-
168
-
169
-
170
-
171
-
172
-
173
-
174
-
175
-
176
-
177
-
178
-
179
-
180
-
181
-
182
-
183
-
184
-
185
-
186
-
187
-
188
-
189
-
190
-
191
-
192
-
193
-
194
-
195
-
196
-
197
-
198
-
199
-
200
-
201
-
202
-
203
-
204
-
205
-
206
-
207
-
208
-
209
-
210
-
211
-
212
-
213
-
214
-
215
-
216
-
217
-
218
-
219
-
220
-
221
-
222
-
223
-
224
-
225
-
226
-
227
-
228
-
229
-
230
-
231
-
232
-
233
-
234
-
235
-
236
-
237
-
238
-
239
-
240
-
 241
241 -
 242
242 -
 243
243 -
 244
244 -
 245
245 -
 246
246 -
 247
247 -
 248
248 -
 249
249 -
 250
250 -
 251
251 -
 252
252 -
 253
253 -
 254
254 -
 255
255 -
 256
256 -
 257
257 -
 258
258 -
 259
259 -
 260
260 -
 261
261 -
262
-
263
-
264
-
265
-
266
-
267
-
268
-
269
-
270
-
271
-
272
-
273
-
274
-
275
-
276
-
277
-
278
-
279
-
280
-
281
-
282
-
283
-
284
-
285
-
286
-
287
-
288
-
289
-
290
-
291
-
292
-
293
-
294
-
295
-
296
-
297
-
298
-
299
-
300
-
301
-
302
-
303
-
304
-
305
-
306
-
307
-
308
-
309
-
310
-
311
-
312
-
313
-
314
-
315
-
316
-
317
-
318
-
319
-
320
-
321
-
322
-
323
-
324
-
325
-
326
-
327
-
328
-
329
-
330
-
331
-
332
-
333
-
334
-
335
-
336
-
337
-
338
-
339
-
340
-
341
-
342
-
343
-
344
-
345
-
346
-
347
-
348
-
349
-
350
-
351
-
352
-
353
-
354
-
355
-
356
-
357
-
358
-
359
-
360
-
361
-
362
-
363
-
364
-
365
-
366
-
367
-
368
-
369
-
370
-
371
-
372
-
373
-
374
-
375
-
376
-
377
-
378
-
379
-
380
-
381
-
382
-
383
-
384
-
385
-
386
-
387
-
388
-
389
-
390
-
391
-
392
-
393
-
394
-
395
-
396
-
397
-
398
-
399
-
400
-
401
-
402
-
403
-
404
-
405
-
406
-
407
-
408
-
409
-
410
-
411
-
412
-
413
-
414
-
415
-
416
-
417
-
418
-
419
-
420
-
421
-
422
-
423
-
424
-
425
-
426
-
427
-
428
-
429
-
430
-
431
-
432
-
433
-
434
-
435
-
436
-
437
-
438
-
439
-
440
-
441
-
442
-
443
-
444
-
445
-
446
-
447
-
448
-
449
-
450
-
451
-
452
-
453
-
454
-
455
-
456
-
457
-
458
-
459
-
460
-
461
-
462
-
463
-
464
-
465
-
466
-
467
-
468
-
469
-
470
-
471
-
472
-
473
-
474
-
475
-
476
-
477
-
478
-
479
-
480
-
481
-
482
-
483
-
484
-
485
-
486
-
487
-
488
-
489
-
490
-
491
-
492
-
493
-
494
-
495
-
496
-
497
-
498
-
499
-
500
-
501
-
502
-
503
-
504
-
505
-
506
-
507
-
508
-
509
-
510
-
511
-
512
-
513
-
514
-
515
-
516
-
517
-
518
-
519
-
520
-
521
-
522
-
523
-
524
-
525
-
526
-
527
-
528
-
529
-
530
-
531
-
532
-
533
-
534
-
535
-
536
-
537
-
538
-
539
-
540
-
541
-
542
-
543
 |
 |

RBS GROUP 2012
249
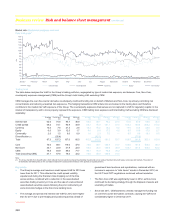
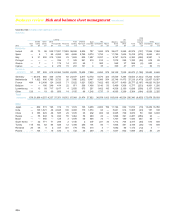
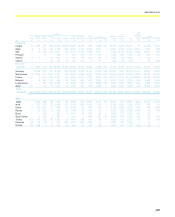
VaR non-trading portfolios
VaR
The table below details VaR for the Group’s non-trading portfolios,
excluding the structured credit portfolio and loans and receivables.
VaR is not always the most appropriate measure of risk for assets in the
banking book and particularly for those in Non-Core, which will diminish
over time as the asset inventory is sold down or run-off.
In order to better represent the risk of the non-trading portfolios, the table
below analyses the VaR for the non-trading portfolios but excludes the
Non-Core structured credit portfolio. These assets are shown separately
on a drawn notional and fair value basis by maturity profile and asset
class. The risk in this portfolio is managed on both a third party asset and
RWA basis.
Also excluded from the non-trading VaR portfolios are the loans and
receivable products that are managed within the credit risk management
framework.
2012 2011 2010
Average
£m
Period end
£m
Maximum
£m
Minimum
£m Average
£m
Period end
£m
Maximum
£m
Minimum
£m
Average
£m
Period end
£m
Maximum
£m
Minimum
£m
Interest rate 6.9 4.5 10.7 4.1 8.8 9.9 11.1 5.7 8.7 10.4 20.5 4.4
Credit spread 10.5 8.8 15.4 7.3 18.2 13.6 39.3 12.1 32.0 16.1 101.2 15.4
Currency 3.0 1.3 4.5 1.3 2.1 4.0 5.9 0.1 2.1 3.0 7.6 0.3
Equity 1.7 0.3 1.9 0.3 2.1 1.9 3.1 1.6 1.2 3.1 4.6 0.2
Diversification (1) (5.4)(13.6) (15.9)
Total 11.8 9.5 18.3 8.5 19.7 15.8 41.6 13.4 30.9 16.7 98.0 13.7
Core 11.3 7.5 19.0 7.1 19.3 15.1 38.9 13.5 30.5 15.6 98.1 12.8
Non-Core 2.5 3.4 3.6 1.6 3.4 2.5 4.3 2.2 1.3 2.8 4.1 0.2
CEM 1.0 1.0 1.1 0.9 0.4 0.9 0.9 0.3
Total (excluding CEM) 11.5 9.4 17.8 8.2 19.7 15.5 41.4 13.7
Note:
(1) The Group benefits from diversification, which reflects the risk reduction achieved by allocating investments across various financial instrument types, currencies and markets. The extent of
diversification benefit depends on the correlation between the assets and risk factors in the portfolio at a particular time.
Key points
x The average and period end total and credit spread VaR were lower
in 2012, due to reduced volatility in the market data time series,
position reductions and a decrease in the size of the collateral
portfolio. The reduction in collateral was driven by the restructuring
of certain Dutch residential mortgage-backed securities during the
first half of 2012, enabling their eligibility as European Central Bank
collateral. This allowed the disposal of additional collateral
purchased during the corresponding period in 2011.
x The average and period end interest rate VaR were lower in 2012,
due to the implementation of an enhanced rates re-scaling
methodology.
x The Non-Core period end VaR was higher in 2012 than in 2011, due
to improvements in the time series mapping on certain Australian
bonds and the purchase of additional hedges.