RBS 2012 Annual Report Download - page 20
Download and view the complete annual report
Please find page 20 of the 2012 RBS annual report below. You can navigate through the pages in the report by either clicking on the pages listed below, or by using the keyword search tool below to find specific information within the annual report.-
 1
1 -
2
-
3
-
4
-
5
-
6
-
7
-
8
-
9
-
 10
10 -
 11
11 -
 12
12 -
 13
13 -
 14
14 -
 15
15 -
 16
16 -
 17
17 -
 18
18 -
 19
19 -
 20
20 -
 21
21 -
 22
22 -
 23
23 -
 24
24 -
 25
25 -
 26
26 -
 27
27 -
 28
28 -
 29
29 -
 30
30 -
31
-
32
-
33
-
34
-
35
-
36
-
37
-
38
-
39
-
40
-
41
-
42
-
43
-
44
-
45
-
46
-
47
-
48
-
49
-
50
-
51
-
52
-
53
-
54
-
55
-
56
-
57
-
58
-
59
-
60
-
61
-
62
-
63
-
64
-
65
-
66
-
67
-
68
-
69
-
70
-
71
-
72
-
73
-
74
-
75
-
76
-
77
-
78
-
79
-
80
-
81
-
82
-
83
-
84
-
85
-
86
-
87
-
88
-
89
-
90
-
91
-
92
-
93
-
94
-
95
-
96
-
97
-
98
-
99
-
100
-
101
-
102
-
103
-
104
-
105
-
106
-
107
-
108
-
109
-
110
-
111
-
112
-
113
-
114
-
115
-
116
-
117
-
118
-
119
-
120
-
121
-
122
-
123
-
124
-
125
-
126
-
127
-
128
-
129
-
130
-
131
-
132
-
133
-
134
-
135
-
136
-
137
-
138
-
139
-
140
-
141
-
142
-
143
-
144
-
145
-
146
-
147
-
148
-
149
-
150
-
151
-
152
-
153
-
154
-
155
-
156
-
157
-
158
-
159
-
160
-
161
-
162
-
163
-
164
-
165
-
166
-
167
-
168
-
169
-
170
-
171
-
172
-
173
-
174
-
175
-
176
-
177
-
178
-
179
-
180
-
181
-
182
-
183
-
184
-
185
-
186
-
187
-
188
-
189
-
190
-
191
-
192
-
193
-
194
-
195
-
196
-
197
-
198
-
199
-
200
-
201
-
202
-
203
-
204
-
205
-
206
-
207
-
208
-
209
-
210
-
211
-
212
-
213
-
214
-
215
-
216
-
217
-
218
-
219
-
220
-
221
-
222
-
223
-
224
-
225
-
226
-
227
-
228
-
229
-
230
-
231
-
232
-
233
-
234
-
235
-
236
-
237
-
238
-
239
-
240
-
241
-
242
-
243
-
244
-
245
-
246
-
247
-
248
-
249
-
250
-
251
-
252
-
253
-
254
-
255
-
256
-
257
-
258
-
259
-
260
-
261
-
262
-
263
-
264
-
265
-
266
-
267
-
268
-
269
-
270
-
271
-
272
-
273
-
274
-
275
-
276
-
277
-
278
-
279
-
280
-
281
-
282
-
283
-
284
-
285
-
286
-
287
-
288
-
289
-
290
-
291
-
292
-
293
-
294
-
295
-
296
-
297
-
298
-
299
-
300
-
301
-
302
-
303
-
304
-
305
-
306
-
307
-
308
-
309
-
310
-
311
-
312
-
313
-
314
-
315
-
316
-
317
-
318
-
319
-
320
-
321
-
322
-
323
-
324
-
325
-
326
-
327
-
328
-
329
-
330
-
331
-
332
-
333
-
334
-
335
-
336
-
337
-
338
-
339
-
340
-
341
-
342
-
343
-
344
-
345
-
346
-
347
-
348
-
349
-
350
-
351
-
352
-
353
-
354
-
355
-
356
-
357
-
358
-
359
-
360
-
361
-
362
-
363
-
364
-
365
-
366
-
367
-
368
-
369
-
370
-
371
-
372
-
373
-
374
-
375
-
376
-
377
-
378
-
379
-
380
-
381
-
382
-
383
-
384
-
385
-
386
-
387
-
388
-
389
-
390
-
391
-
392
-
393
-
394
-
395
-
396
-
397
-
398
-
399
-
400
-
401
-
402
-
403
-
404
-
405
-
406
-
407
-
408
-
409
-
410
-
411
-
412
-
413
-
414
-
415
-
416
-
417
-
418
-
419
-
420
-
421
-
422
-
423
-
424
-
425
-
426
-
427
-
428
-
429
-
430
-
431
-
432
-
433
-
434
-
435
-
436
-
437
-
438
-
439
-
440
-
441
-
442
-
443
-
444
-
445
-
446
-
447
-
448
-
449
-
450
-
451
-
452
-
453
-
454
-
455
-
456
-
457
-
458
-
459
-
460
-
461
-
462
-
463
-
464
-
465
-
466
-
467
-
468
-
469
-
470
-
471
-
472
-
473
-
474
-
475
-
476
-
477
-
478
-
479
-
480
-
481
-
482
-
483
-
484
-
485
-
486
-
487
-
488
-
489
-
490
-
491
-
492
-
493
-
494
-
495
-
496
-
497
-
498
-
499
-
500
-
501
-
502
-
503
-
504
-
505
-
506
-
507
-
508
-
509
-
510
-
511
-
512
-
513
-
514
-
515
-
516
-
517
-
518
-
519
-
520
-
521
-
522
-
523
-
524
-
525
-
526
-
527
-
528
-
529
-
530
-
531
-
532
-
533
-
534
-
535
-
536
-
537
-
538
-
539
-
540
-
541
-
542
-
543
 |
 |
18
OUR BUSINESS AND OUR STRATEGY
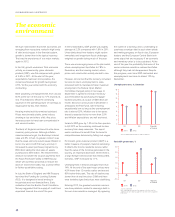
We have noted before that when economies are
emerging from recessions rooted in high levels
of debt and stresses in the financial system,
growth is slower than in the typical recovery.
That was the experience of our major markets
again in 2012.
In the UK, growth weakened. Total economic
activity, as measured by gross domestic
product (GDP), was flat compared with growth
of 0.9% in 2011. At the start of the year,
expectations had been more positive, the
consensus forecast for growth having been
0.5%. Yet the year ended with the economy
contracting.
More positively, unemployment fell, from around
8.3% at the turn of the year to 7.7% towards its
end. That helped to offset the continuing
squeeze on the spending power of earnings as
wages grew by less than inflation.
Housing market activity remained subdued.
Prices were broadly stable, some indices
showing a rise and others a fall. Any price
increases seem to have been concentrated in
and around London.
The Bank of England continued its ultra-loose
monetary policy stance. Although inflation
remained above target, the Bank kept interest
rates at 0.5%. In fact, its greater concern was
that the weak economy would cause inflation to
be too low and in both February and July it
increased its asset purchase programme by
£50 billion taking the total value of assets
purchased to £375 billion. The Government’s
decision to transfer the coupon payments from
the Asset Purchase Facility to HM Treasury,
which will use these proceeds to reduce the
stock of Government debt, has a similar effect
to further quantitative easing.
In July, the Bank of England and HM Treasury
launched the Funding for Lending Scheme
(FLS). It is designed to boost lending to
households and non-financial firms. Early
indications from the Bank’s Credit Conditions
Survey suggested that the supply of credit had
expanded towards the end of the year.
In the United States, GDP growth was slightly
stronger at 2.2% compared with 1.8% in 2011.
Uncertainty about how leaders might resolve
immediate and longer-term fiscal challenges
weighed on growth during much of the year.
There was encouraging news on the job market,
where unemployment had fallen to 7.8% in
December, and the housing market, where
prices and construction activity started to rise.
However, concerned that the recovery remained
too slow to return unemployment to rates
consistent with its mandate to foster maximum
employment, the Federal Open Market
Committee changed policy in two ways. In
September it agreed to increase monetary
accommodation by purchasing mortgage-
backed securities at a pace of $40 billion per
month. Second, it announced in December it
anticipates the Fed Funds rate remaining
exceptionally low as long as the unemployment
rate is above 6.5%, inflation one to two years
ahead is expected to be no more than 2.5%
and inflation expectations are well anchored.
Ireland’s GDP grew by 1.3% in the four quarters
to Q3 2012 as the economy continued its slow
recovery from deep recession. The export
sector continued to benefit from the boost to
competitiveness delivered by falling real wages.
For Ireland, gross national product (GNP) is a
better measure of people's material well-being.
It reflects the income residents receive rather
than the value of the incomes generated in the
country, an important distinction where there is
a large foreign-owned sector that remits profits
overseas. GNP increased by 1.1%.
Unemployment in Ireland averaged more than
14%. At the end of the year house prices were
4.5% lower than 12 months earlier and around
50% below their peak. The rate of decline was
slower than at any time since 2008 and there
were tentative signs that prices were stabilising.
Entering 2012, the greatest economic concern
was how problems related to sovereign debt in
the euro zone would be managed. By agreeing
the outline of a banking union, undertaking to
purchase sovereign debt to push down yields
and making progress on fiscal rules, European
leaders and the European Central Bank took
some steps that are necessary if an economic
and monetary union is to be sustained. At the
end of the year the probability that some of the
worse outcomes would be realised had fallen
although they had not disappeared. Despite
this progress, euro zone GDP contracted and
unemployment had risen to almost 12% by
December.
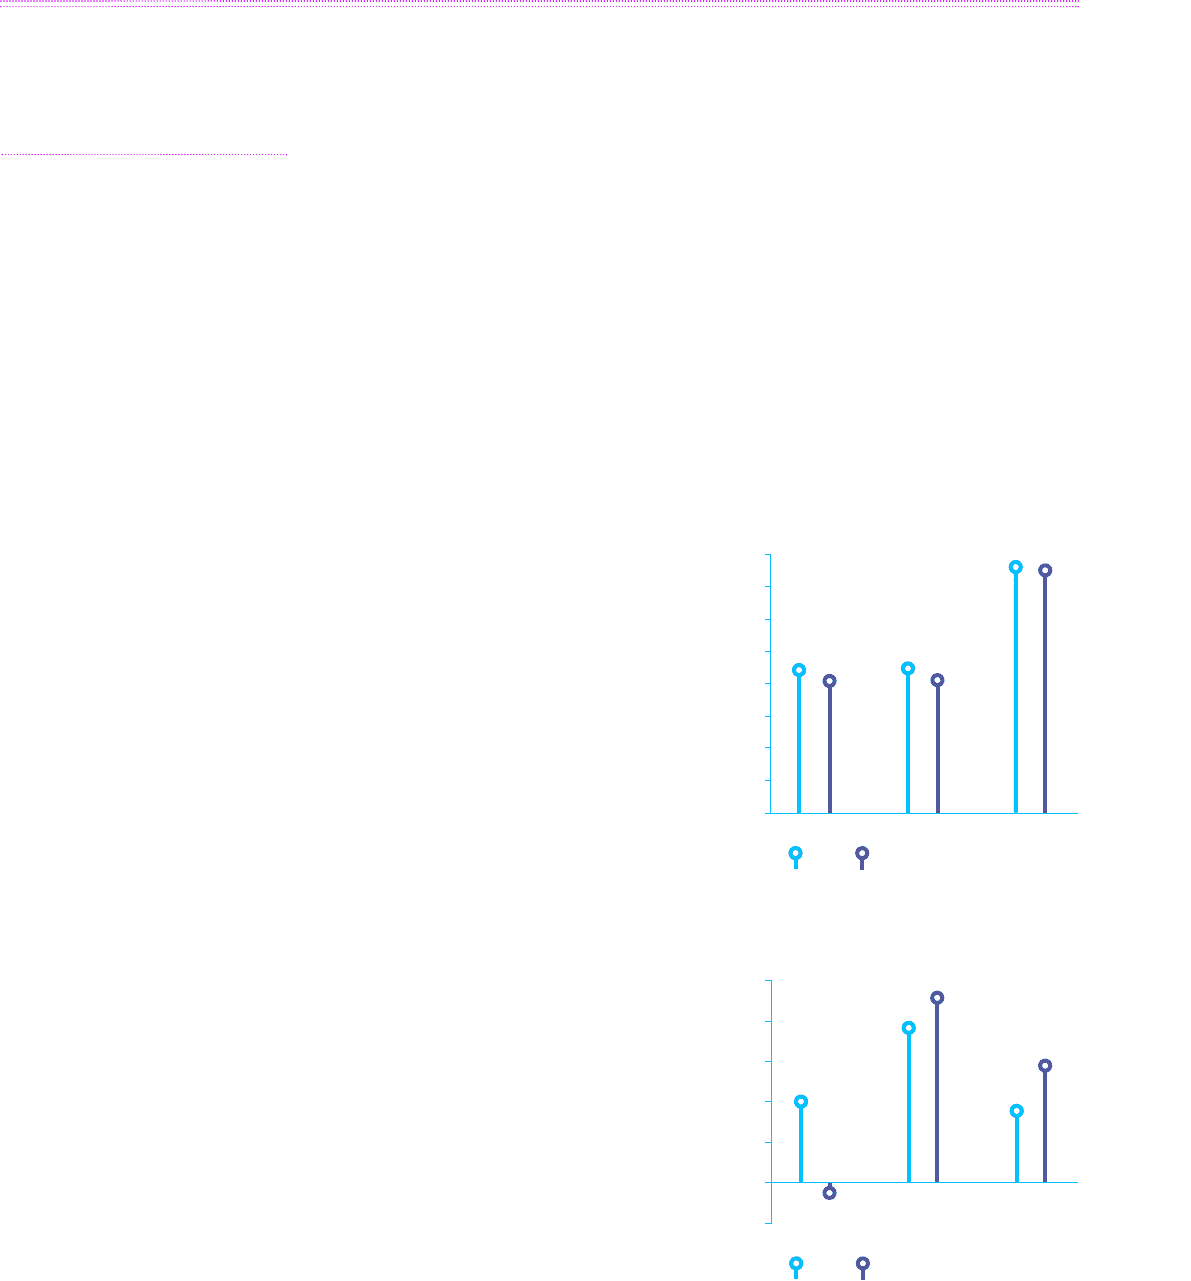
The economic
environment
16
14
12
10
8
6
4
2
0
UK US Republic
of Ireland
2011
Sources: Datastream and Office for National Statistics
2012
Unemployment rates, %, December
Real GDP growth rates, %
2.5
2.0
1.5
1.0
0.5
0
-0.5
UK US Republic
of Ireland
Sources: Datastream
Note: Ireland growth rates are four quarters to Q3 2012 over four
quarters to Q3 2011 and four quarters to Q3 2011 over four quarters
to Q3 2010
2011 2012