RBS 2012 Annual Report Download - page 331
Download and view the complete annual report
Please find page 331 of the 2012 RBS annual report below. You can navigate through the pages in the report by either clicking on the pages listed below, or by using the keyword search tool below to find specific information within the annual report.-
 1
1 -
2
-
3
-
4
-
5
-
6
-
7
-
8
-
9
-
10
-
11
-
12
-
13
-
14
-
15
-
16
-
17
-
18
-
19
-
20
-
21
-
22
-
23
-
24
-
25
-
26
-
27
-
28
-
29
-
30
-
31
-
32
-
33
-
34
-
35
-
36
-
37
-
38
-
39
-
40
-
41
-
42
-
43
-
44
-
45
-
46
-
47
-
48
-
49
-
50
-
51
-
52
-
53
-
54
-
55
-
56
-
57
-
58
-
59
-
60
-
61
-
62
-
63
-
64
-
65
-
66
-
67
-
68
-
69
-
70
-
71
-
72
-
73
-
74
-
75
-
76
-
77
-
78
-
79
-
80
-
81
-
82
-
83
-
84
-
85
-
86
-
87
-
88
-
89
-
90
-
91
-
92
-
93
-
94
-
95
-
96
-
97
-
98
-
99
-
100
-
101
-
102
-
103
-
104
-
105
-
106
-
107
-
108
-
109
-
110
-
111
-
112
-
113
-
114
-
115
-
116
-
117
-
118
-
119
-
120
-
121
-
122
-
123
-
124
-
125
-
126
-
127
-
128
-
129
-
130
-
131
-
132
-
133
-
134
-
135
-
136
-
137
-
138
-
139
-
140
-
141
-
142
-
143
-
144
-
145
-
146
-
147
-
148
-
149
-
150
-
151
-
152
-
153
-
154
-
155
-
156
-
157
-
158
-
159
-
160
-
161
-
162
-
163
-
164
-
165
-
166
-
167
-
168
-
169
-
170
-
171
-
172
-
173
-
174
-
175
-
176
-
177
-
178
-
179
-
180
-
181
-
182
-
183
-
184
-
185
-
186
-
187
-
188
-
189
-
190
-
191
-
192
-
193
-
194
-
195
-
196
-
197
-
198
-
199
-
200
-
201
-
202
-
203
-
204
-
205
-
206
-
207
-
208
-
209
-
210
-
211
-
212
-
213
-
214
-
215
-
216
-
217
-
218
-
219
-
220
-
221
-
222
-
223
-
224
-
225
-
226
-
227
-
228
-
229
-
230
-
231
-
232
-
233
-
234
-
235
-
236
-
237
-
238
-
239
-
240
-
241
-
242
-
243
-
244
-
245
-
246
-
247
-
248
-
249
-
250
-
251
-
252
-
253
-
254
-
255
-
256
-
257
-
258
-
259
-
260
-
261
-
262
-
263
-
264
-
265
-
266
-
267
-
268
-
269
-
270
-
271
-
272
-
273
-
274
-
275
-
276
-
277
-
278
-
279
-
280
-
281
-
282
-
283
-
284
-
285
-
286
-
287
-
288
-
289
-
290
-
291
-
292
-
293
-
294
-
295
-
296
-
297
-
298
-
299
-
300
-
301
-
302
-
303
-
304
-
305
-
306
-
307
-
308
-
309
-
310
-
311
-
312
-
313
-
314
-
315
-
316
-
317
-
318
-
319
-
320
-
 321
321 -
 322
322 -
 323
323 -
 324
324 -
 325
325 -
 326
326 -
 327
327 -
 328
328 -
 329
329 -
 330
330 -
 331
331 -
 332
332 -
 333
333 -
 334
334 -
 335
335 -
 336
336 -
 337
337 -
 338
338 -
 339
339 -
 340
340 -
 341
341 -
342
-
343
-
344
-
345
-
346
-
347
-
348
-
349
-
350
-
351
-
352
-
353
-
354
-
355
-
356
-
357
-
358
-
359
-
360
-
361
-
362
-
363
-
364
-
365
-
366
-
367
-
368
-
369
-
370
-
371
-
372
-
373
-
374
-
375
-
376
-
377
-
378
-
379
-
380
-
381
-
382
-
383
-
384
-
385
-
386
-
387
-
388
-
389
-
390
-
391
-
392
-
393
-
394
-
395
-
396
-
397
-
398
-
399
-
400
-
401
-
402
-
403
-
404
-
405
-
406
-
407
-
408
-
409
-
410
-
411
-
412
-
413
-
414
-
415
-
416
-
417
-
418
-
419
-
420
-
421
-
422
-
423
-
424
-
425
-
426
-
427
-
428
-
429
-
430
-
431
-
432
-
433
-
434
-
435
-
436
-
437
-
438
-
439
-
440
-
441
-
442
-
443
-
444
-
445
-
446
-
447
-
448
-
449
-
450
-
451
-
452
-
453
-
454
-
455
-
456
-
457
-
458
-
459
-
460
-
461
-
462
-
463
-
464
-
465
-
466
-
467
-
468
-
469
-
470
-
471
-
472
-
473
-
474
-
475
-
476
-
477
-
478
-
479
-
480
-
481
-
482
-
483
-
484
-
485
-
486
-
487
-
488
-
489
-
490
-
491
-
492
-
493
-
494
-
495
-
496
-
497
-
498
-
499
-
500
-
501
-
502
-
503
-
504
-
505
-
506
-
507
-
508
-
509
-
510
-
511
-
512
-
513
-
514
-
515
-
516
-
517
-
518
-
519
-
520
-
521
-
522
-
523
-
524
-
525
-
526
-
527
-
528
-
529
-
530
-
531
-
532
-
533
-
534
-
535
-
536
-
537
-
538
-
539
-
540
-
541
-
542
-
543
 |
 |

RBS GROUP 2012
329
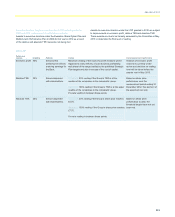
LTIP awards - performance criteria for awards to be granted in 2013 and
due to vest in 2016
Awards that will be granted to executive directors in 2013 will be subject
to four performance categories, each with equal weighting. These are set
out below.
Core bank economic profit (25%)
The Economic Profit measure is focused on the Core bank to ensure that
performance reflects enduring earnings for the bank. Economic Profit,
being a risk-adjusted financial measure, is consistent with the FSA Code
and also provides a balance between measuring growth and the cost of
capital employed in delivering that growth. Core bank Economic Profit is
defined as Core bank Operating Profit after Tax less attributed equity
multiplied by the cost of equity, where:
Core bank Operating Profit after Tax is Core Operating Profit taxed at a
standard tax rate.
Attributed Equity is defined as equity allocated to the Core businesses,
calculated as a function of the Core businesses risk-weighted asset base.
Current Cost of Equity is 11.5%, which is subject to review at least
annually.
Details of the actual targets, and performance against these, will be
disclosed retrospectively once the awards vest.
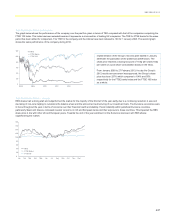
Relative Total Shareholder Return (25%)
The relative TSR measure provides a direct connection between
executive directors’ awards and relative performance delivered to
shareholders. The measure compares the Group's performance against a
group of comparator banks from the UK and overseas, weighted towards
those companies most similar to the Group. Performance is measured
over a three year performance period.
Relative TSR Comparator Group
Weighting
1 Barclays 200%
2 Lloyds Banking Group
3 HSBC 150%
4 Standard Chartered
5 to 20
Bank of America, BBVA, BNP Paribas, Citigroup, Credit
Agricole, Credit Suisse Group, Deutsche Bank, JP
Morgan Chase, National Australia Bank Limited, Royal
Bank of Canada, Santander, Societe Generale, The
Toronto-Dominion Bank Group, UBS, Unicredito, Wells
Fargo & Company
50%
x 20% of the award will vest if the Group’s TSR is at the median of the
companies in the comparator group.
x 100% of the award will vest if the Group’s TSR is at the upper
quartile of the companies in the comparator group.
Balance Sheet & Risk (25%)
The Balance Sheet & Risk measures have a particular focus on risk
reduction, the resolution of the Non-Core business and the building of a
sustainable and responsible franchise for the Group.
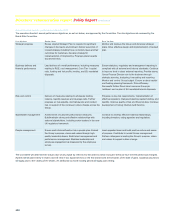
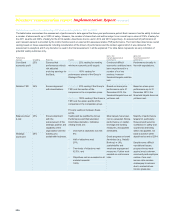
Strategic Scorecard (25%)
The balanced Strategic Scorecard rewards management for delivering a
robust basis for future growth in terms of the strength of our franchise,
efficiency, reputation, and the engagement of employees.
Performance measures
Non-Core Run-Down
Core Tier 1 capital ratio
Wholesale funding
Liquidity reserves
Leverage ratio
Loan:deposit ratio
Balance
Sheet and Risk
measures
and targets
Earnings volatility
Customer franchise
Cost:income ratio in Core bank
Lending targets
Sustainability performance
Strategic
Scorecard
measures
and targets Progress in people issues
Both quantitative and qualitative strategic measures are used, including
measures relating to reputation, customer excellence, organisational
capability and sustainability, given that these will support the long-term
goals of the business. Targets for each measure are set at the start of the
performance period and, where applicable, are aligned with the Group’s
Strategic Plan targets. Commentary will be provided on an annual basis
in relation to progress against the targets, where these are not
commercially sensitive.
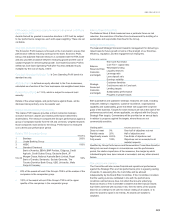
Vesting point Indicative performance
Does not meet 0% Over half of objectives not met
Partially meets 25% Half of objectives met
Significantly meets 62.5% Two-thirds of objectives met
Fully meets 100% Objectives met or exceeded in all
material respects
Qualified by Group Performance and Remuneration Committee discretion
taking into account changes in circumstances over the performance
period, the relative importance of the measures, the margin by which
individual targets have been missed or exceeded, and any other relevant
factors.
Risk underpin and clawback
The Committee will also review financial and operational performance
against the Strategic Plan and risk performance prior to agreeing vesting
of awards. In assessing this, the Committee will be advised
independently by the Board Risk Committee. If the Committee considers
that the vesting outcome calibrated in line with the performance
conditions outlined above does not reflect the Group's underlying
financial results or if the Committee considers that the financial results
have been achieved with excessive risk, then the terms of the awards
allow for an underpin to be used to reduce vesting of an award, or to
allow the award to lapse in its entirety. All awards are subject to
clawback.