RBS 2012 Annual Report Download - page 194
Download and view the complete annual report
Please find page 194 of the 2012 RBS annual report below. You can navigate through the pages in the report by either clicking on the pages listed below, or by using the keyword search tool below to find specific information within the annual report.-
 1
1 -
2
-
3
-
4
-
5
-
6
-
7
-
8
-
9
-
10
-
11
-
12
-
13
-
14
-
15
-
16
-
17
-
18
-
19
-
20
-
21
-
22
-
23
-
24
-
25
-
26
-
27
-
28
-
29
-
30
-
31
-
32
-
33
-
34
-
35
-
36
-
37
-
38
-
39
-
40
-
41
-
42
-
43
-
44
-
45
-
46
-
47
-
48
-
49
-
50
-
51
-
52
-
53
-
54
-
55
-
56
-
57
-
58
-
59
-
60
-
61
-
62
-
63
-
64
-
65
-
66
-
67
-
68
-
69
-
70
-
71
-
72
-
73
-
74
-
75
-
76
-
77
-
78
-
79
-
80
-
81
-
82
-
83
-
84
-
85
-
86
-
87
-
88
-
89
-
90
-
91
-
92
-
93
-
94
-
95
-
96
-
97
-
98
-
99
-
100
-
101
-
102
-
103
-
104
-
105
-
106
-
107
-
108
-
109
-
110
-
111
-
112
-
113
-
114
-
115
-
116
-
117
-
118
-
119
-
120
-
121
-
122
-
123
-
124
-
125
-
126
-
127
-
128
-
129
-
130
-
131
-
132
-
133
-
134
-
135
-
136
-
137
-
138
-
139
-
140
-
141
-
142
-
143
-
144
-
145
-
146
-
147
-
148
-
149
-
150
-
151
-
152
-
153
-
154
-
155
-
156
-
157
-
158
-
159
-
160
-
161
-
162
-
163
-
164
-
165
-
166
-
167
-
168
-
169
-
170
-
171
-
172
-
173
-
174
-
175
-
176
-
177
-
178
-
179
-
180
-
181
-
182
-
183
-
 184
184 -
 185
185 -
 186
186 -
 187
187 -
 188
188 -
 189
189 -
 190
190 -
 191
191 -
 192
192 -
 193
193 -
 194
194 -
 195
195 -
 196
196 -
 197
197 -
 198
198 -
 199
199 -
 200
200 -
 201
201 -
 202
202 -
 203
203 -
 204
204 -
205
-
206
-
207
-
208
-
209
-
210
-
211
-
212
-
213
-
214
-
215
-
216
-
217
-
218
-
219
-
220
-
221
-
222
-
223
-
224
-
225
-
226
-
227
-
228
-
229
-
230
-
231
-
232
-
233
-
234
-
235
-
236
-
237
-
238
-
239
-
240
-
241
-
242
-
243
-
244
-
245
-
246
-
247
-
248
-
249
-
250
-
251
-
252
-
253
-
254
-
255
-
256
-
257
-
258
-
259
-
260
-
261
-
262
-
263
-
264
-
265
-
266
-
267
-
268
-
269
-
270
-
271
-
272
-
273
-
274
-
275
-
276
-
277
-
278
-
279
-
280
-
281
-
282
-
283
-
284
-
285
-
286
-
287
-
288
-
289
-
290
-
291
-
292
-
293
-
294
-
295
-
296
-
297
-
298
-
299
-
300
-
301
-
302
-
303
-
304
-
305
-
306
-
307
-
308
-
309
-
310
-
311
-
312
-
313
-
314
-
315
-
316
-
317
-
318
-
319
-
320
-
321
-
322
-
323
-
324
-
325
-
326
-
327
-
328
-
329
-
330
-
331
-
332
-
333
-
334
-
335
-
336
-
337
-
338
-
339
-
340
-
341
-
342
-
343
-
344
-
345
-
346
-
347
-
348
-
349
-
350
-
351
-
352
-
353
-
354
-
355
-
356
-
357
-
358
-
359
-
360
-
361
-
362
-
363
-
364
-
365
-
366
-
367
-
368
-
369
-
370
-
371
-
372
-
373
-
374
-
375
-
376
-
377
-
378
-
379
-
380
-
381
-
382
-
383
-
384
-
385
-
386
-
387
-
388
-
389
-
390
-
391
-
392
-
393
-
394
-
395
-
396
-
397
-
398
-
399
-
400
-
401
-
402
-
403
-
404
-
405
-
406
-
407
-
408
-
409
-
410
-
411
-
412
-
413
-
414
-
415
-
416
-
417
-
418
-
419
-
420
-
421
-
422
-
423
-
424
-
425
-
426
-
427
-
428
-
429
-
430
-
431
-
432
-
433
-
434
-
435
-
436
-
437
-
438
-
439
-
440
-
441
-
442
-
443
-
444
-
445
-
446
-
447
-
448
-
449
-
450
-
451
-
452
-
453
-
454
-
455
-
456
-
457
-
458
-
459
-
460
-
461
-
462
-
463
-
464
-
465
-
466
-
467
-
468
-
469
-
470
-
471
-
472
-
473
-
474
-
475
-
476
-
477
-
478
-
479
-
480
-
481
-
482
-
483
-
484
-
485
-
486
-
487
-
488
-
489
-
490
-
491
-
492
-
493
-
494
-
495
-
496
-
497
-
498
-
499
-
500
-
501
-
502
-
503
-
504
-
505
-
506
-
507
-
508
-
509
-
510
-
511
-
512
-
513
-
514
-
515
-
516
-
517
-
518
-
519
-
520
-
521
-
522
-
523
-
524
-
525
-
526
-
527
-
528
-
529
-
530
-
531
-
532
-
533
-
534
-
535
-
536
-
537
-
538
-
539
-
540
-
541
-
542
-
543
 |
 |

192
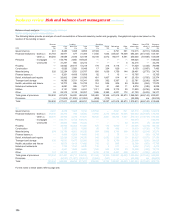
Business review Risk and balance sheet management continued
Key credit portfolios*: Ulster Bank Group (Core and Non-Core) continued
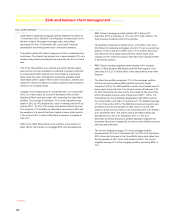
Key points
x Core REIL increased by £2.0 billion during the year, which reflects
continued difficult conditions in both the commercial and residential
property sectors in Ireland.
x Core mortgage REIL accounted for £1.0 billion of the overall
increase, the trend reflecting continued deterioration of
macroeconomic factors. However, the number of properties
repossessed in 2012 was 127 (81 on a voluntary basis) compared
with 161 (123 on a voluntary basis) in 2011.
x Core corporate REIL accounted for £1.0 billion of the overall
increase, the movement driven by a small number of renegotiated
arrangements for higher value real estate customers.
x Core coverage increased from 50% to 52% as a result of additional
impairment charges on the non-performing book due to further
deterioration in collateral values. Core coverage is diluted due to the
increased REIL relating to corporate renegotiations with lower
provision requirements. Adjusting for these cases Core coverage
would be 56%.
x Non-Core REIL decreased by £0.3 billion reflecting lower defaults as
well as recoveries and write-offs of £0.2 billion.
x At 31 December 2012, 60% of REIL was in Non-Core (2011 - 68%).
The majority of the Non-Core commercial real estate development
portfolio is non-performing with provision coverage of 65%.
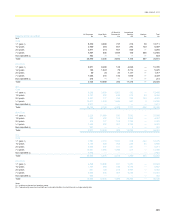
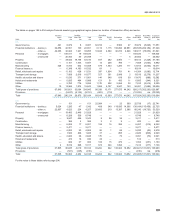
Geographical analysis
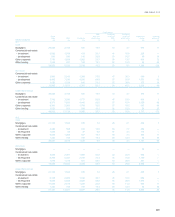
Commercial real estate
The commercial real estate lending portfolio for Ulster Bank Group (Core and Non-Core) totalled £15.3 billion at 31 December 2012, of which £11.0
billion or 72% was in Non-Core. The geographic split of the total Ulster Bank Group commercial real estate portfolio, based on the location of the
underlying security, remained similar to 2011, with 63% in the Republic of Ireland, 26% in Northern Ireland and 11% in the UK (excluding Northern
Ireland).
Investment Development
Exposure by geography Commercial
£m
Residential
£m
Commercial
£m
Residential
£m
Total
£m
2012
ROI 3,546 779 1,603 3,653 9,581
NI 1,083 210 631 2,059 3,983
UK (excluding NI) 1,239 86 82 290 1,697
RoW 14 1 8 10 33
5,882 1,076 2,324 6,012 15,294
2011
ROI 3,775 853 1,911 4,095 10,634
NI 1,322 279 680 2,222 4,503
UK (excluding NI) 1,371 111 95 336 1,913
RoW 27 4 — 32 63
6,495 1,247 2,686 6,685 17,113
2010
Ireland (ROI and NI) 5,032 1,098 2,785 6,578 15,493
UK (excluding NI) 1,869 115 110 359 2,453
RoW 23 1 — 18 42
6,924 1,214 2,895 6,955 17,988
*unaudited