RBS 2012 Annual Report Download - page 165
Download and view the complete annual report
Please find page 165 of the 2012 RBS annual report below. You can navigate through the pages in the report by either clicking on the pages listed below, or by using the keyword search tool below to find specific information within the annual report.-
 1
1 -
2
-
3
-
4
-
5
-
6
-
7
-
8
-
9
-
10
-
11
-
12
-
13
-
14
-
15
-
16
-
17
-
18
-
19
-
20
-
21
-
22
-
23
-
24
-
25
-
26
-
27
-
28
-
29
-
30
-
31
-
32
-
33
-
34
-
35
-
36
-
37
-
38
-
39
-
40
-
41
-
42
-
43
-
44
-
45
-
46
-
47
-
48
-
49
-
50
-
51
-
52
-
53
-
54
-
55
-
56
-
57
-
58
-
59
-
60
-
61
-
62
-
63
-
64
-
65
-
66
-
67
-
68
-
69
-
70
-
71
-
72
-
73
-
74
-
75
-
76
-
77
-
78
-
79
-
80
-
81
-
82
-
83
-
84
-
85
-
86
-
87
-
88
-
89
-
90
-
91
-
92
-
93
-
94
-
95
-
96
-
97
-
98
-
99
-
100
-
101
-
102
-
103
-
104
-
105
-
106
-
107
-
108
-
109
-
110
-
111
-
112
-
113
-
114
-
115
-
116
-
117
-
118
-
119
-
120
-
121
-
122
-
123
-
124
-
125
-
126
-
127
-
128
-
129
-
130
-
131
-
132
-
133
-
134
-
135
-
136
-
137
-
138
-
139
-
140
-
141
-
142
-
143
-
144
-
145
-
146
-
147
-
148
-
149
-
150
-
151
-
152
-
153
-
154
-
 155
155 -
 156
156 -
 157
157 -
 158
158 -
 159
159 -
 160
160 -
 161
161 -
 162
162 -
 163
163 -
 164
164 -
 165
165 -
 166
166 -
 167
167 -
 168
168 -
 169
169 -
 170
170 -
 171
171 -
 172
172 -
 173
173 -
 174
174 -
 175
175 -
176
-
177
-
178
-
179
-
180
-
181
-
182
-
183
-
184
-
185
-
186
-
187
-
188
-
189
-
190
-
191
-
192
-
193
-
194
-
195
-
196
-
197
-
198
-
199
-
200
-
201
-
202
-
203
-
204
-
205
-
206
-
207
-
208
-
209
-
210
-
211
-
212
-
213
-
214
-
215
-
216
-
217
-
218
-
219
-
220
-
221
-
222
-
223
-
224
-
225
-
226
-
227
-
228
-
229
-
230
-
231
-
232
-
233
-
234
-
235
-
236
-
237
-
238
-
239
-
240
-
241
-
242
-
243
-
244
-
245
-
246
-
247
-
248
-
249
-
250
-
251
-
252
-
253
-
254
-
255
-
256
-
257
-
258
-
259
-
260
-
261
-
262
-
263
-
264
-
265
-
266
-
267
-
268
-
269
-
270
-
271
-
272
-
273
-
274
-
275
-
276
-
277
-
278
-
279
-
280
-
281
-
282
-
283
-
284
-
285
-
286
-
287
-
288
-
289
-
290
-
291
-
292
-
293
-
294
-
295
-
296
-
297
-
298
-
299
-
300
-
301
-
302
-
303
-
304
-
305
-
306
-
307
-
308
-
309
-
310
-
311
-
312
-
313
-
314
-
315
-
316
-
317
-
318
-
319
-
320
-
321
-
322
-
323
-
324
-
325
-
326
-
327
-
328
-
329
-
330
-
331
-
332
-
333
-
334
-
335
-
336
-
337
-
338
-
339
-
340
-
341
-
342
-
343
-
344
-
345
-
346
-
347
-
348
-
349
-
350
-
351
-
352
-
353
-
354
-
355
-
356
-
357
-
358
-
359
-
360
-
361
-
362
-
363
-
364
-
365
-
366
-
367
-
368
-
369
-
370
-
371
-
372
-
373
-
374
-
375
-
376
-
377
-
378
-
379
-
380
-
381
-
382
-
383
-
384
-
385
-
386
-
387
-
388
-
389
-
390
-
391
-
392
-
393
-
394
-
395
-
396
-
397
-
398
-
399
-
400
-
401
-
402
-
403
-
404
-
405
-
406
-
407
-
408
-
409
-
410
-
411
-
412
-
413
-
414
-
415
-
416
-
417
-
418
-
419
-
420
-
421
-
422
-
423
-
424
-
425
-
426
-
427
-
428
-
429
-
430
-
431
-
432
-
433
-
434
-
435
-
436
-
437
-
438
-
439
-
440
-
441
-
442
-
443
-
444
-
445
-
446
-
447
-
448
-
449
-
450
-
451
-
452
-
453
-
454
-
455
-
456
-
457
-
458
-
459
-
460
-
461
-
462
-
463
-
464
-
465
-
466
-
467
-
468
-
469
-
470
-
471
-
472
-
473
-
474
-
475
-
476
-
477
-
478
-
479
-
480
-
481
-
482
-
483
-
484
-
485
-
486
-
487
-
488
-
489
-
490
-
491
-
492
-
493
-
494
-
495
-
496
-
497
-
498
-
499
-
500
-
501
-
502
-
503
-
504
-
505
-
506
-
507
-
508
-
509
-
510
-
511
-
512
-
513
-
514
-
515
-
516
-
517
-
518
-
519
-
520
-
521
-
522
-
523
-
524
-
525
-
526
-
527
-
528
-
529
-
530
-
531
-
532
-
533
-
534
-
535
-
536
-
537
-
538
-
539
-
540
-
541
-
542
-
543
 |
 |

RBS GROUP 2012
163
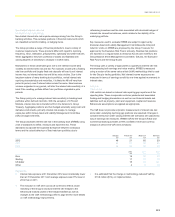
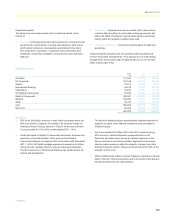
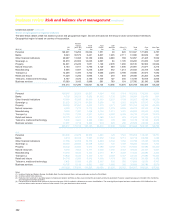
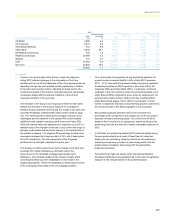
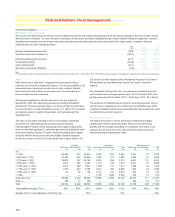
Credit risk assets*
The tables and commentary below refer to credit risk assets, which
consist of:
x Lending - Comprises gross loans and advances to: central and local
governments; central banks, including cash balances; other banks
and financial institutions, incorporating overdraft and other short-
term credit lines; corporates, in large part loans and leases; and
individuals, comprising mortgages, personal loans and credit card
balances.
x Derivatives - Comprises the mark-to-market (mtm) value of such
contracts after the effect of enforceable netting agreements, but
before the effect of collateral. Figures shown apply counterparty
netting within the regulatory capital model used.
x Contingent obligations - Comprises primarily letters of credit and
guarantees.
Credit risk assets exclude issuer risk (primarily debt securities) and
reverse repurchase arrangements. They take account of legal netting
arrangements that provide a right of legal set-off, but do not meet the
offset criteria under IFRS.
Divisional analysis
2012 2011 2010
£m £m £m
UK Retail 114,120 111,070 108,302
UK Corporate 101,148 105,078 108,663
Wealth 19,913 20,079 18,875
International Banking 64,518 72,737 80,166
Ulster Bank 34,232 37,781 40,750
US Retail & Commercial 55,036 56,546 51,779
Retail & Commercial 388,967 403,291 408,535
Markets 106,336 114,327 124,330
Other 65,186 64,517 36,659
Core 560,489 582,135 569,524
Non-Core 65,220 92,709 125,383
625,709 674,844 694,907
Key points
x 56% of the £49 billion reduction in total credit risk assets was in the
Non-Core division. Exposure decreased in all divisions except UK
Retail and Group Treasury (shown in ‘Other’). At the year end Non-
Core accounted for 10% of the overall assets (2011 - 14%).
x Credit risk assets in Retail & Commercial continued to increase as a
proportion of the total portfolio. At the year end the Retail &
Commercial divisions increased to 62% of the total credit risk assets
(2011 - 60%). UK Retail mortgage exposure increased by £4 billion
during the year, partially offset by reduced unsecured exposures.
The fall in exposure in International Banking was spread across all
sectors and geographies.
x The fall in the Markets division predominantly reflected reduction in
exposure to banks, other financial institutions and sovereigns in
Western Europe.
x Non-Core declined £27 billon (30% of the 2011 portfolio) during
2012 driven by material disposals, repayments and run off.
Reduction has taken place across all material segments as the
Group continues to de-risk the portfolio. Significant actions were
taken to reduce exposure within the property, transport and other
financial institution sectors. These sectors accounted for 69% of the
reduction in Non-Core.
x Other predominantly relates to Group Treasury’s exposure to central
banks in the UK, USA and Germany and is a function of the Group’s
liquidity requirements and cash positions.
*unaudited