RBS 2012 Annual Report Download - page 51
Download and view the complete annual report
Please find page 51 of the 2012 RBS annual report below. You can navigate through the pages in the report by either clicking on the pages listed below, or by using the keyword search tool below to find specific information within the annual report.-
 1
1 -
2
-
3
-
4
-
5
-
6
-
7
-
8
-
9
-
10
-
11
-
12
-
13
-
14
-
15
-
16
-
17
-
18
-
19
-
20
-
21
-
22
-
23
-
24
-
25
-
26
-
27
-
28
-
29
-
30
-
31
-
32
-
33
-
34
-
35
-
36
-
37
-
38
-
39
-
40
-
 41
41 -
 42
42 -
 43
43 -
 44
44 -
 45
45 -
 46
46 -
 47
47 -
 48
48 -
 49
49 -
 50
50 -
 51
51 -
 52
52 -
 53
53 -
 54
54 -
 55
55 -
 56
56 -
 57
57 -
 58
58 -
 59
59 -
 60
60 -
 61
61 -
62
-
63
-
64
-
65
-
66
-
67
-
68
-
69
-
70
-
71
-
72
-
73
-
74
-
75
-
76
-
77
-
78
-
79
-
80
-
81
-
82
-
83
-
84
-
85
-
86
-
87
-
88
-
89
-
90
-
91
-
92
-
93
-
94
-
95
-
96
-
97
-
98
-
99
-
100
-
101
-
102
-
103
-
104
-
105
-
106
-
107
-
108
-
109
-
110
-
111
-
112
-
113
-
114
-
115
-
116
-
117
-
118
-
119
-
120
-
121
-
122
-
123
-
124
-
125
-
126
-
127
-
128
-
129
-
130
-
131
-
132
-
133
-
134
-
135
-
136
-
137
-
138
-
139
-
140
-
141
-
142
-
143
-
144
-
145
-
146
-
147
-
148
-
149
-
150
-
151
-
152
-
153
-
154
-
155
-
156
-
157
-
158
-
159
-
160
-
161
-
162
-
163
-
164
-
165
-
166
-
167
-
168
-
169
-
170
-
171
-
172
-
173
-
174
-
175
-
176
-
177
-
178
-
179
-
180
-
181
-
182
-
183
-
184
-
185
-
186
-
187
-
188
-
189
-
190
-
191
-
192
-
193
-
194
-
195
-
196
-
197
-
198
-
199
-
200
-
201
-
202
-
203
-
204
-
205
-
206
-
207
-
208
-
209
-
210
-
211
-
212
-
213
-
214
-
215
-
216
-
217
-
218
-
219
-
220
-
221
-
222
-
223
-
224
-
225
-
226
-
227
-
228
-
229
-
230
-
231
-
232
-
233
-
234
-
235
-
236
-
237
-
238
-
239
-
240
-
241
-
242
-
243
-
244
-
245
-
246
-
247
-
248
-
249
-
250
-
251
-
252
-
253
-
254
-
255
-
256
-
257
-
258
-
259
-
260
-
261
-
262
-
263
-
264
-
265
-
266
-
267
-
268
-
269
-
270
-
271
-
272
-
273
-
274
-
275
-
276
-
277
-
278
-
279
-
280
-
281
-
282
-
283
-
284
-
285
-
286
-
287
-
288
-
289
-
290
-
291
-
292
-
293
-
294
-
295
-
296
-
297
-
298
-
299
-
300
-
301
-
302
-
303
-
304
-
305
-
306
-
307
-
308
-
309
-
310
-
311
-
312
-
313
-
314
-
315
-
316
-
317
-
318
-
319
-
320
-
321
-
322
-
323
-
324
-
325
-
326
-
327
-
328
-
329
-
330
-
331
-
332
-
333
-
334
-
335
-
336
-
337
-
338
-
339
-
340
-
341
-
342
-
343
-
344
-
345
-
346
-
347
-
348
-
349
-
350
-
351
-
352
-
353
-
354
-
355
-
356
-
357
-
358
-
359
-
360
-
361
-
362
-
363
-
364
-
365
-
366
-
367
-
368
-
369
-
370
-
371
-
372
-
373
-
374
-
375
-
376
-
377
-
378
-
379
-
380
-
381
-
382
-
383
-
384
-
385
-
386
-
387
-
388
-
389
-
390
-
391
-
392
-
393
-
394
-
395
-
396
-
397
-
398
-
399
-
400
-
401
-
402
-
403
-
404
-
405
-
406
-
407
-
408
-
409
-
410
-
411
-
412
-
413
-
414
-
415
-
416
-
417
-
418
-
419
-
420
-
421
-
422
-
423
-
424
-
425
-
426
-
427
-
428
-
429
-
430
-
431
-
432
-
433
-
434
-
435
-
436
-
437
-
438
-
439
-
440
-
441
-
442
-
443
-
444
-
445
-
446
-
447
-
448
-
449
-
450
-
451
-
452
-
453
-
454
-
455
-
456
-
457
-
458
-
459
-
460
-
461
-
462
-
463
-
464
-
465
-
466
-
467
-
468
-
469
-
470
-
471
-
472
-
473
-
474
-
475
-
476
-
477
-
478
-
479
-
480
-
481
-
482
-
483
-
484
-
485
-
486
-
487
-
488
-
489
-
490
-
491
-
492
-
493
-
494
-
495
-
496
-
497
-
498
-
499
-
500
-
501
-
502
-
503
-
504
-
505
-
506
-
507
-
508
-
509
-
510
-
511
-
512
-
513
-
514
-
515
-
516
-
517
-
518
-
519
-
520
-
521
-
522
-
523
-
524
-
525
-
526
-
527
-
528
-
529
-
530
-
531
-
532
-
533
-
534
-
535
-
536
-
537
-
538
-
539
-
540
-
541
-
542
-
543
 |
 |

RBS GROUP 2012
49
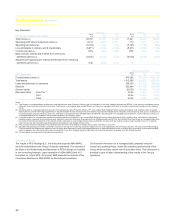
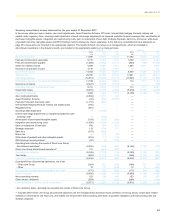
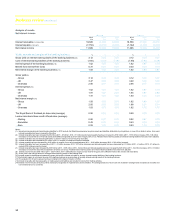
Non-operating items
A gain on the movement in own credit adjustments of £1,914 million was
recorded in 2011 as Group credit spreads widened. This compares with a
smaller gain of £242 million in 2010.
The Asset Protection Scheme is accounted for as a credit derivative and
movements in the fair value of the contract are taken as non-operating
items. The APS fair value charge was £906 million in 2011. The
cumulative charge for the APS was £2,456 million as at 31 December
2011.
A charge of £850 million was booked in relation to Payment Protection
Insurance (PPI) claims following the British Bankers’ Association
decision, in May 2011, not to appeal the findings of the Judicial Review.
An impairment of £1,099 million was taken on the Group’s AFS bond
portfolio in 2011 as a result of the decline in the value of Greek sovereign
bonds. As of 31 December 2011, the bonds were marked at 21% of par
value.
Integration and restructuring costs remained broadly flat at £1,016 million,
reflecting significant Markets restructuring in 2011.
In 2011, the Group redeemed certain mortgage backed debt securities in
exchange for cash, resulting in gains totalling £255 million. This
compared with a gain of £553 million in 2010 on a liability management
exercise to redeem a number of Tier 1 and upper Tier 2 securities.
The Finance Act 2011 introduced an annual bank levy in the UK. The
levy is based on the total chargeable equity and liabilities as reported in
the balance sheet at the end of a chargeable period. The cost of the levy
to the Group for 2011 was £300 million.
Tax
The tax charge was £1,127 million in 2011, compared with £703 million in
2010. The high tax charge for the year reflects profits in high tax regimes
(principally US) and losses in low tax regimes (principally Ireland), losses
in overseas subsidiaries for which a deferred tax asset has not been
recognised (principally Ireland and the Netherlands) and the effect of the
two reductions of 1% in the rate of UK corporation tax enacted in March
2011 and July 2011 on the net deferred tax balance.
Earnings
Basic loss per ordinary and B share from continuing operations increased
from a loss of 2.9p per share to a loss of 21.3p per share. Adjusted
earnings per ordinary and B share fell from, 6.1p per share to a loss of
0.8p per share.
2011 compared with 2010 - statutory
Operating loss
Operating loss before tax for the year was £1,190 million compared with
£154 million in 2010.
Total income
Total income decreased 7% to £24,651 million in 2011.
Net interest income
Net interest income decreased by 11% to £12,303 million.
Non-interest income
Non-interest income decreased to £12,348 million from £12,840 million in
2010. This included movements in the fair value of the Asset Protection
Scheme resulting in a £906 million charge (2010 - £1,550 million), gain
on redemption of own debt of £255 million (2010 - £553 million) and a
gain on movements in own credit adjustments of £1,914 million (2010 -
£242 million gain). Excluding these items, non-interest income was down
18% primarily reflecting a reduction in income from trading activities and
lower net fees and commissions.
Operating expenses
Operating expenses decreased to £17,134 million (2010 - £17,456
million) of which integration and restructuring costs were £1,016 million
compared with £1,012 million in 2010.
Impairment losses
Impairment losses were £8,707 million, compared with £9,235 million in
2010.
Risk elements in lending represented 8.6% of gross loans and advances
to customers excluding reverse repos at 31 December 2011 (2010 -
7.3%).
Provision coverage of risk elements in lending was 49% (2010 - 47%).
Tax
The tax charge for 2011 was £1,127 million (2010 - £703 million).
Loss per share
Basic loss per ordinary share from continuing operations was 21.3p per
share compared with 2.9p per share in 2010.