RBS 2012 Annual Report Download - page 422
Download and view the complete annual report
Please find page 422 of the 2012 RBS annual report below. You can navigate through the pages in the report by either clicking on the pages listed below, or by using the keyword search tool below to find specific information within the annual report.-
 1
1 -
2
-
3
-
4
-
5
-
6
-
7
-
8
-
9
-
10
-
11
-
12
-
13
-
14
-
15
-
16
-
17
-
18
-
19
-
20
-
21
-
22
-
23
-
24
-
25
-
26
-
27
-
28
-
29
-
30
-
31
-
32
-
33
-
34
-
35
-
36
-
37
-
38
-
39
-
40
-
41
-
42
-
43
-
44
-
45
-
46
-
47
-
48
-
49
-
50
-
51
-
52
-
53
-
54
-
55
-
56
-
57
-
58
-
59
-
60
-
61
-
62
-
63
-
64
-
65
-
66
-
67
-
68
-
69
-
70
-
71
-
72
-
73
-
74
-
75
-
76
-
77
-
78
-
79
-
80
-
81
-
82
-
83
-
84
-
85
-
86
-
87
-
88
-
89
-
90
-
91
-
92
-
93
-
94
-
95
-
96
-
97
-
98
-
99
-
100
-
101
-
102
-
103
-
104
-
105
-
106
-
107
-
108
-
109
-
110
-
111
-
112
-
113
-
114
-
115
-
116
-
117
-
118
-
119
-
120
-
121
-
122
-
123
-
124
-
125
-
126
-
127
-
128
-
129
-
130
-
131
-
132
-
133
-
134
-
135
-
136
-
137
-
138
-
139
-
140
-
141
-
142
-
143
-
144
-
145
-
146
-
147
-
148
-
149
-
150
-
151
-
152
-
153
-
154
-
155
-
156
-
157
-
158
-
159
-
160
-
161
-
162
-
163
-
164
-
165
-
166
-
167
-
168
-
169
-
170
-
171
-
172
-
173
-
174
-
175
-
176
-
177
-
178
-
179
-
180
-
181
-
182
-
183
-
184
-
185
-
186
-
187
-
188
-
189
-
190
-
191
-
192
-
193
-
194
-
195
-
196
-
197
-
198
-
199
-
200
-
201
-
202
-
203
-
204
-
205
-
206
-
207
-
208
-
209
-
210
-
211
-
212
-
213
-
214
-
215
-
216
-
217
-
218
-
219
-
220
-
221
-
222
-
223
-
224
-
225
-
226
-
227
-
228
-
229
-
230
-
231
-
232
-
233
-
234
-
235
-
236
-
237
-
238
-
239
-
240
-
241
-
242
-
243
-
244
-
245
-
246
-
247
-
248
-
249
-
250
-
251
-
252
-
253
-
254
-
255
-
256
-
257
-
258
-
259
-
260
-
261
-
262
-
263
-
264
-
265
-
266
-
267
-
268
-
269
-
270
-
271
-
272
-
273
-
274
-
275
-
276
-
277
-
278
-
279
-
280
-
281
-
282
-
283
-
284
-
285
-
286
-
287
-
288
-
289
-
290
-
291
-
292
-
293
-
294
-
295
-
296
-
297
-
298
-
299
-
300
-
301
-
302
-
303
-
304
-
305
-
306
-
307
-
308
-
309
-
310
-
311
-
312
-
313
-
314
-
315
-
316
-
317
-
318
-
319
-
320
-
321
-
322
-
323
-
324
-
325
-
326
-
327
-
328
-
329
-
330
-
331
-
332
-
333
-
334
-
335
-
336
-
337
-
338
-
339
-
340
-
341
-
342
-
343
-
344
-
345
-
346
-
347
-
348
-
349
-
350
-
351
-
352
-
353
-
354
-
355
-
356
-
357
-
358
-
359
-
360
-
361
-
362
-
363
-
364
-
365
-
366
-
367
-
368
-
369
-
370
-
371
-
372
-
373
-
374
-
375
-
376
-
377
-
378
-
379
-
380
-
381
-
382
-
383
-
384
-
385
-
386
-
387
-
388
-
389
-
390
-
391
-
392
-
393
-
394
-
395
-
396
-
397
-
398
-
399
-
400
-
401
-
402
-
403
-
404
-
405
-
406
-
407
-
408
-
409
-
410
-
411
-
 412
412 -
 413
413 -
 414
414 -
 415
415 -
 416
416 -
 417
417 -
 418
418 -
 419
419 -
 420
420 -
 421
421 -
 422
422 -
 423
423 -
 424
424 -
 425
425 -
 426
426 -
 427
427 -
 428
428 -
 429
429 -
 430
430 -
 431
431 -
 432
432 -
433
-
434
-
435
-
436
-
437
-
438
-
439
-
440
-
441
-
442
-
443
-
444
-
445
-
446
-
447
-
448
-
449
-
450
-
451
-
452
-
453
-
454
-
455
-
456
-
457
-
458
-
459
-
460
-
461
-
462
-
463
-
464
-
465
-
466
-
467
-
468
-
469
-
470
-
471
-
472
-
473
-
474
-
475
-
476
-
477
-
478
-
479
-
480
-
481
-
482
-
483
-
484
-
485
-
486
-
487
-
488
-
489
-
490
-
491
-
492
-
493
-
494
-
495
-
496
-
497
-
498
-
499
-
500
-
501
-
502
-
503
-
504
-
505
-
506
-
507
-
508
-
509
-
510
-
511
-
512
-
513
-
514
-
515
-
516
-
517
-
518
-
519
-
520
-
521
-
522
-
523
-
524
-
525
-
526
-
527
-
528
-
529
-
530
-
531
-
532
-
533
-
534
-
535
-
536
-
537
-
538
-
539
-
540
-
541
-
542
-
543
 |
 |

420
Notes on the consolidated accounts continued
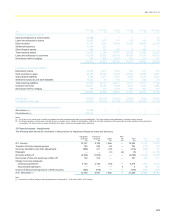
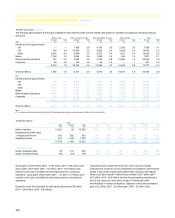
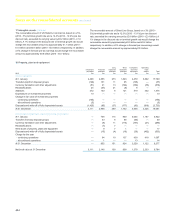
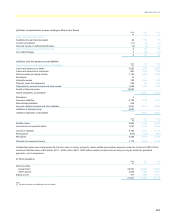
15 Debt securities continued
The following table analyses the Group's available-for-sale debt securities and the related yield (based on weighted averages) by remaining maturity
and issuer.
Within 1 year After 1 but within 5 years After 5 but within 10 years After 10 years Total
Amount Yield Amount Yield Amount Yield Amount Yield Amount Yield
2012 £m % £m % £m % £m % £m %
Central and local governments
- UK — — 1,559 2.0 4,1053.3 2,286 3.5 7,950 3.1
- US 139 2.4 10,633 2.3 6,022 2.4 2,246 2.5 19,040 2.3
- other 3,346 0.6 5,849 3.0 5,273 3.0 1,527 3.4 15,995 2.6
Banks 1,764 1.6 3,294 2.8 1,6851.2 484 1.6 7,227 2.1
Other financial institutions 741 3.0 5,289 2.5 4,378 3.0 12,886 1.4 23,294 2.0
Corporate 25 2.5 140 2.4 66 1.2 — — 231 2.0
6,015 1.2 26,764 2.5 21,529 2.7 19,429 2.0 73,737 2.3
Of which ABS (1) 1,385 1.8 6,413 2.9 6,773 2.4 15,613 1.4 30,184 2.0
2011
Central and local governments
- UK 65 0.1 3,489 2.8 7,067 3.3 2,815 3.2 13,436 3.1
- US 1,471 1.2 8,026 2.1 9,8652.8 1,486 3.2 20,848 2.5
- other 6,219 1.0 9,511 3.1 7,366 3.9 2,456 4.2 25,552 2.9
Banks 3,632 3.1 6,324 3.3 2,066 3.2 1,153 2.7 13,175 3.2
Other financial institutions 1,091 2.8 6,459 2.7 6,906 2.9 17,296 2.2 31,752 2.5
Corporate 145 4.5 1,425 4.6 776 4.4 189 3.6 2,535 4.5
12,623 1.9 35,234 2.9 34,046 3.2 25,395 2.6 107,298 2.8
Of which ABS (1) 2,442 2.1 9,021 2.9 9,409 2.8 19,863 2.1 40,735 2.5
Note:
(1) Includes asset-backed securities issued by US federal agencies and government sponsored entities, and covered bonds.
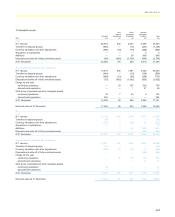
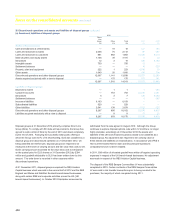
16 Equity shares
2012 2011 2010
Listed Unlisted Total Listed Unlisted Total Listed Unlisted Total
£m £m £m £m £m £m £m £m £m
Held-for-trading 13,261 68 13,329 12,366 67 12,433 19,110 76 19,186
Designated as at fair value
through profit or loss 251 282 533 373 401 774 282 731 1,013
Available-for-sale 221 1,149 1,370 609 1,367 1,976 650 1,349 1,999
13,733 1,499 15,232 13,348 1,835 15,183 20,042 2,156 22,198
Available-for-sale
Gross unrealised gains 58 172 230 69 317 386 67 232 299
Gross unrealised losses (54)(13)(67)(19)(114)(133)(17)(145) (162)
Gross gains of £166 million (2011 - £152 million; 2010 - £82 million) and
gross losses of £2 million (2011 - £2 million; 2010 - £63 million) were
realised on the sale of available-for-sale equity shares in continuing
operations. Gross gains of £23 million (2011 - nil; 2010 - £1 million) were
realised on the sale of available-for-sale equity shares in discontinued
operations.
Dividend income from available-for-sale equity shares was £59 million
(2011 - £54 million; 2010 - £59 million).
Unquoted equity investments whose fair value cannot be reliably
measured are carried at cost and classified as available-for-sale financial
assets. They include capital stock (redeemable at cost) in the Federal
Home Loan Bank and the Federal Reserve Bank of £0.7 billion (2011 -
£0.7 billion; 2010 - £0.8 billion) that the Group's banking subsidiaries in
the US are required to hold; and a number of individually small
shareholdings in unlisted companies. Disposals in the year generated a
gain of £2 million (2011 - £2 million gain; 2010 - £2 million loss).