RBS 2012 Annual Report Download - page 88
Download and view the complete annual report
Please find page 88 of the 2012 RBS annual report below. You can navigate through the pages in the report by either clicking on the pages listed below, or by using the keyword search tool below to find specific information within the annual report.-
 1
1 -
2
-
3
-
4
-
5
-
6
-
7
-
8
-
9
-
10
-
11
-
12
-
13
-
14
-
15
-
16
-
17
-
18
-
19
-
20
-
21
-
22
-
23
-
24
-
25
-
26
-
27
-
28
-
29
-
30
-
31
-
32
-
33
-
34
-
35
-
36
-
37
-
38
-
39
-
40
-
41
-
42
-
43
-
44
-
45
-
46
-
47
-
48
-
49
-
50
-
51
-
52
-
53
-
54
-
55
-
56
-
57
-
58
-
59
-
60
-
61
-
62
-
63
-
64
-
65
-
66
-
67
-
68
-
69
-
70
-
71
-
72
-
73
-
74
-
75
-
76
-
77
-
 78
78 -
 79
79 -
 80
80 -
 81
81 -
 82
82 -
 83
83 -
 84
84 -
 85
85 -
 86
86 -
 87
87 -
 88
88 -
 89
89 -
 90
90 -
 91
91 -
 92
92 -
 93
93 -
 94
94 -
 95
95 -
 96
96 -
 97
97 -
 98
98 -
99
-
100
-
101
-
102
-
103
-
104
-
105
-
106
-
107
-
108
-
109
-
110
-
111
-
112
-
113
-
114
-
115
-
116
-
117
-
118
-
119
-
120
-
121
-
122
-
123
-
124
-
125
-
126
-
127
-
128
-
129
-
130
-
131
-
132
-
133
-
134
-
135
-
136
-
137
-
138
-
139
-
140
-
141
-
142
-
143
-
144
-
145
-
146
-
147
-
148
-
149
-
150
-
151
-
152
-
153
-
154
-
155
-
156
-
157
-
158
-
159
-
160
-
161
-
162
-
163
-
164
-
165
-
166
-
167
-
168
-
169
-
170
-
171
-
172
-
173
-
174
-
175
-
176
-
177
-
178
-
179
-
180
-
181
-
182
-
183
-
184
-
185
-
186
-
187
-
188
-
189
-
190
-
191
-
192
-
193
-
194
-
195
-
196
-
197
-
198
-
199
-
200
-
201
-
202
-
203
-
204
-
205
-
206
-
207
-
208
-
209
-
210
-
211
-
212
-
213
-
214
-
215
-
216
-
217
-
218
-
219
-
220
-
221
-
222
-
223
-
224
-
225
-
226
-
227
-
228
-
229
-
230
-
231
-
232
-
233
-
234
-
235
-
236
-
237
-
238
-
239
-
240
-
241
-
242
-
243
-
244
-
245
-
246
-
247
-
248
-
249
-
250
-
251
-
252
-
253
-
254
-
255
-
256
-
257
-
258
-
259
-
260
-
261
-
262
-
263
-
264
-
265
-
266
-
267
-
268
-
269
-
270
-
271
-
272
-
273
-
274
-
275
-
276
-
277
-
278
-
279
-
280
-
281
-
282
-
283
-
284
-
285
-
286
-
287
-
288
-
289
-
290
-
291
-
292
-
293
-
294
-
295
-
296
-
297
-
298
-
299
-
300
-
301
-
302
-
303
-
304
-
305
-
306
-
307
-
308
-
309
-
310
-
311
-
312
-
313
-
314
-
315
-
316
-
317
-
318
-
319
-
320
-
321
-
322
-
323
-
324
-
325
-
326
-
327
-
328
-
329
-
330
-
331
-
332
-
333
-
334
-
335
-
336
-
337
-
338
-
339
-
340
-
341
-
342
-
343
-
344
-
345
-
346
-
347
-
348
-
349
-
350
-
351
-
352
-
353
-
354
-
355
-
356
-
357
-
358
-
359
-
360
-
361
-
362
-
363
-
364
-
365
-
366
-
367
-
368
-
369
-
370
-
371
-
372
-
373
-
374
-
375
-
376
-
377
-
378
-
379
-
380
-
381
-
382
-
383
-
384
-
385
-
386
-
387
-
388
-
389
-
390
-
391
-
392
-
393
-
394
-
395
-
396
-
397
-
398
-
399
-
400
-
401
-
402
-
403
-
404
-
405
-
406
-
407
-
408
-
409
-
410
-
411
-
412
-
413
-
414
-
415
-
416
-
417
-
418
-
419
-
420
-
421
-
422
-
423
-
424
-
425
-
426
-
427
-
428
-
429
-
430
-
431
-
432
-
433
-
434
-
435
-
436
-
437
-
438
-
439
-
440
-
441
-
442
-
443
-
444
-
445
-
446
-
447
-
448
-
449
-
450
-
451
-
452
-
453
-
454
-
455
-
456
-
457
-
458
-
459
-
460
-
461
-
462
-
463
-
464
-
465
-
466
-
467
-
468
-
469
-
470
-
471
-
472
-
473
-
474
-
475
-
476
-
477
-
478
-
479
-
480
-
481
-
482
-
483
-
484
-
485
-
486
-
487
-
488
-
489
-
490
-
491
-
492
-
493
-
494
-
495
-
496
-
497
-
498
-
499
-
500
-
501
-
502
-
503
-
504
-
505
-
506
-
507
-
508
-
509
-
510
-
511
-
512
-
513
-
514
-
515
-
516
-
517
-
518
-
519
-
520
-
521
-
522
-
523
-
524
-
525
-
526
-
527
-
528
-
529
-
530
-
531
-
532
-
533
-
534
-
535
-
536
-
537
-
538
-
539
-
540
-
541
-
542
-
543
 |
 |

86
Business review continued
Markets continued
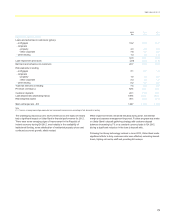
2012 compared with 2011
Operating profit increased by 68% reflecting 2% growth in income and
20% decrease in direct expenses, most notably through a reduction in
staff costs.
Rates benefited from a strong trading performance, while losses incurred
in managing counterparty exposures during the third quarter of 2011
were not repeated during 2012. Revenues for the year were up 36% to
£2.0 billion.
Currencies volumes were weak across the industry, although the Spot FX
business minimised the impact on revenue. Options income was limited
by further Eurozone uncertainty.
Asset Backed Products continued to perform strongly as markets were
sustained throughout the year by investors’ search for yield. Revenues
for the year were £1.3 billion, up 5% from a strong performance of £1.25
billion in 2011.
A 40% increase in Credit Markets revenue to £862 million was driven by
Flow Credit which, as a result of improved risk management and more
benign market conditions, recorded good profitability compared with a
loss in 2011. This was partially offset by weaker earnings from credit
origination.
The 62% decrease in IPED followed significantly weaker client volumes
in key markets. The business has been restructured and rationalised. It
will be reported within Rates going forward.
The division focused on controlling costs throughout 2012, driving total
expenses down by 16%. Lower staff expenses, down 26%, reflect lower
headcount and lower levels of variable compensation, including
reductions and clawbacks following the Group’s LIBOR settlements
reached on 6 February 2013, with the compensation ratio falling from
42% to 32%. Headcount reductions totalled 2,700 in the year, including
that resulting from the exit of businesses announced in January. Other
expenses fell by 3% as rigorous controls on discretionary expenditure
and the exiting of product areas continued to take effect, partially offset
by higher legal expenses.
The reduction in third party assets reflected management action to
optimise and de-risk the balance sheet, consistent with previously
disclosed medium-term objectives.
The division reduced risk-weighted assets, successfully focusing on
lowering risk and enhancing models whilst managing the requirement for
greater prudence in the regulatory environment.
Not reflected in Markets operating results in 2012 were the following
items: £381 million for regulatory fines; £350 million for its share of the
provision for interest rate swap redress; and approximately £700 million
in restructuring costs associated with the strategic changes that took
place during 2012.
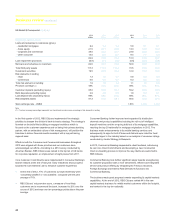
2011 compared with 2010
Operating profit fell by 67%, from £2,724 million for 2010 to £899 million
for 2011, driven by a 29% decrease in revenue. The year was
characterised by volatile and deteriorating credit markets, especially
during the second half of the year when the European sovereign debt
crisis drove a sharp widening in credit spreads.
Due to this deterioration in the markets both the Rates and Credit
businesses suffered significantly, and income from trading activities fell
from £4,785 million in 2010 to £3,602 million in 2011. The heightened
volatility increased risk aversion amongst clients and limited opportunities
for revenue generation in the secondary markets.
Total costs increased by 1% due to increased investment costs in 2011,
which included a programme to meet new regulatory requirements. The
compensation ratio in Markets was 42%, driven by fixed salary costs and
prior year deferred awards.
Variable compensation accrued in the first half of the year were reduced
in the second half of the year, leaving the former GBM 2011 variable
compensation awards 58% lower than 2010.
Third party assets fell from £338.0 billion in 2010 to £312.6 billion in 2011
as a result of lower levels of activity and careful management of balance
sheet exposures.
A 9% increase in risk-weighted assets reflected the impact of significant
regulatory changes, with a £21 billion uplift as a result of CRD III, largely
offset by the impact of the division’s focus on risk management.