RBS 2012 Annual Report Download - page 386
Download and view the complete annual report
Please find page 386 of the 2012 RBS annual report below. You can navigate through the pages in the report by either clicking on the pages listed below, or by using the keyword search tool below to find specific information within the annual report.-
 1
1 -
2
-
3
-
4
-
5
-
6
-
7
-
8
-
9
-
10
-
11
-
12
-
13
-
14
-
15
-
16
-
17
-
18
-
19
-
20
-
21
-
22
-
23
-
24
-
25
-
26
-
27
-
28
-
29
-
30
-
31
-
32
-
33
-
34
-
35
-
36
-
37
-
38
-
39
-
40
-
41
-
42
-
43
-
44
-
45
-
46
-
47
-
48
-
49
-
50
-
51
-
52
-
53
-
54
-
55
-
56
-
57
-
58
-
59
-
60
-
61
-
62
-
63
-
64
-
65
-
66
-
67
-
68
-
69
-
70
-
71
-
72
-
73
-
74
-
75
-
76
-
77
-
78
-
79
-
80
-
81
-
82
-
83
-
84
-
85
-
86
-
87
-
88
-
89
-
90
-
91
-
92
-
93
-
94
-
95
-
96
-
97
-
98
-
99
-
100
-
101
-
102
-
103
-
104
-
105
-
106
-
107
-
108
-
109
-
110
-
111
-
112
-
113
-
114
-
115
-
116
-
117
-
118
-
119
-
120
-
121
-
122
-
123
-
124
-
125
-
126
-
127
-
128
-
129
-
130
-
131
-
132
-
133
-
134
-
135
-
136
-
137
-
138
-
139
-
140
-
141
-
142
-
143
-
144
-
145
-
146
-
147
-
148
-
149
-
150
-
151
-
152
-
153
-
154
-
155
-
156
-
157
-
158
-
159
-
160
-
161
-
162
-
163
-
164
-
165
-
166
-
167
-
168
-
169
-
170
-
171
-
172
-
173
-
174
-
175
-
176
-
177
-
178
-
179
-
180
-
181
-
182
-
183
-
184
-
185
-
186
-
187
-
188
-
189
-
190
-
191
-
192
-
193
-
194
-
195
-
196
-
197
-
198
-
199
-
200
-
201
-
202
-
203
-
204
-
205
-
206
-
207
-
208
-
209
-
210
-
211
-
212
-
213
-
214
-
215
-
216
-
217
-
218
-
219
-
220
-
221
-
222
-
223
-
224
-
225
-
226
-
227
-
228
-
229
-
230
-
231
-
232
-
233
-
234
-
235
-
236
-
237
-
238
-
239
-
240
-
241
-
242
-
243
-
244
-
245
-
246
-
247
-
248
-
249
-
250
-
251
-
252
-
253
-
254
-
255
-
256
-
257
-
258
-
259
-
260
-
261
-
262
-
263
-
264
-
265
-
266
-
267
-
268
-
269
-
270
-
271
-
272
-
273
-
274
-
275
-
276
-
277
-
278
-
279
-
280
-
281
-
282
-
283
-
284
-
285
-
286
-
287
-
288
-
289
-
290
-
291
-
292
-
293
-
294
-
295
-
296
-
297
-
298
-
299
-
300
-
301
-
302
-
303
-
304
-
305
-
306
-
307
-
308
-
309
-
310
-
311
-
312
-
313
-
314
-
315
-
316
-
317
-
318
-
319
-
320
-
321
-
322
-
323
-
324
-
325
-
326
-
327
-
328
-
329
-
330
-
331
-
332
-
333
-
334
-
335
-
336
-
337
-
338
-
339
-
340
-
341
-
342
-
343
-
344
-
345
-
346
-
347
-
348
-
349
-
350
-
351
-
352
-
353
-
354
-
355
-
356
-
357
-
358
-
359
-
360
-
361
-
362
-
363
-
364
-
365
-
366
-
367
-
368
-
369
-
370
-
371
-
372
-
373
-
374
-
375
-
 376
376 -
 377
377 -
 378
378 -
 379
379 -
 380
380 -
 381
381 -
 382
382 -
 383
383 -
 384
384 -
 385
385 -
 386
386 -
 387
387 -
 388
388 -
 389
389 -
 390
390 -
 391
391 -
 392
392 -
 393
393 -
 394
394 -
 395
395 -
 396
396 -
397
-
398
-
399
-
400
-
401
-
402
-
403
-
404
-
405
-
406
-
407
-
408
-
409
-
410
-
411
-
412
-
413
-
414
-
415
-
416
-
417
-
418
-
419
-
420
-
421
-
422
-
423
-
424
-
425
-
426
-
427
-
428
-
429
-
430
-
431
-
432
-
433
-
434
-
435
-
436
-
437
-
438
-
439
-
440
-
441
-
442
-
443
-
444
-
445
-
446
-
447
-
448
-
449
-
450
-
451
-
452
-
453
-
454
-
455
-
456
-
457
-
458
-
459
-
460
-
461
-
462
-
463
-
464
-
465
-
466
-
467
-
468
-
469
-
470
-
471
-
472
-
473
-
474
-
475
-
476
-
477
-
478
-
479
-
480
-
481
-
482
-
483
-
484
-
485
-
486
-
487
-
488
-
489
-
490
-
491
-
492
-
493
-
494
-
495
-
496
-
497
-
498
-
499
-
500
-
501
-
502
-
503
-
504
-
505
-
506
-
507
-
508
-
509
-
510
-
511
-
512
-
513
-
514
-
515
-
516
-
517
-
518
-
519
-
520
-
521
-
522
-
523
-
524
-
525
-
526
-
527
-
528
-
529
-
530
-
531
-
532
-
533
-
534
-
535
-
536
-
537
-
538
-
539
-
540
-
541
-
542
-
543
 |
 |

384
Notes on the consolidated accounts continued
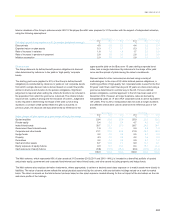
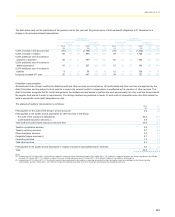
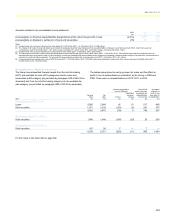
4 Pensions continued
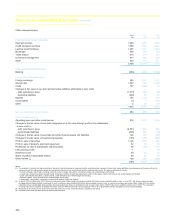
The pension charge to the income statement comprises:
2012
£m
2011
£m
2010
£m
Continuing operations 375 348 441
Discontinued operations 30 1 21
405 349 462
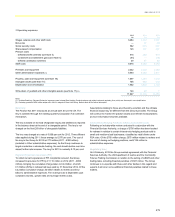
Curtailment gains of £9 million (2011 - nil; 2010 - £78 million) were
recognised in 2012 arising from changes to pension benefits in a
subsidiary’s scheme. Settlement gains of £32 million were recognised in
2012 (2011 and 2010 - nil) in respect of subsidiaries schemes.
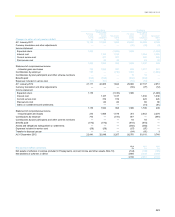
Following the legal separation of ABN AMRO Bank N.V. on 1 April 2010,
ABN AMRO’s principal pension scheme in the Netherlands was
transferred to the State of the Netherlands. At 31 December 2009, this
scheme had fair value of plan assets of £8,118 million and present value
of defined benefit obligations of £8,298 million. The principal actuarial
assumptions at 31 December 2009 were: discount rate 5.25%; expected
return on plan assets (weighted average) 5.25%; rate of increase in
salaries 2.5%; rate of increase in pensions in payment 2.0%; and inflation
assumption 2.0%.
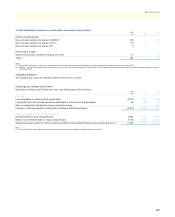
The Group and the Trustees of the Main scheme agreed the funding
valuation as at 31 March 2010 in 2011. It showed that the value of
liabilities exceeded the value of assets by £3.5 billion as at 31 March
2010, a ratio of assets to liabilities of 84%. In order to eliminate this
deficit, the Group will pay additional contributions each year over the
period 2011 to 2018. Contributions started at £375 million per annum in
2011, increasing to £400 million per annum in 2013 and from 2016
onwards will be further increased in line with price inflation. These
contributions are in addition to the regular annual contributions of around
£250 million for future accrual of benefits.
The Group expects to contribute a total of £766 million to its defined
benefit pension schemes in 2013 (Main scheme - £650 million). Of the
net liabilities of schemes in deficit, £168 million relates to unfunded
schemes.
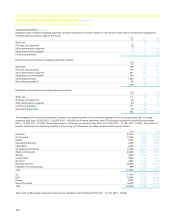
Cumulative net actuarial losses of £7,075 million (2011 - £4,805 million;
2010 - £4,224 million) have been recognised in the statement of
comprehensive income, of which £5,367 million losses (2011 -
£3,589 million; 2010 - £3,252 million) relate to the Main scheme.
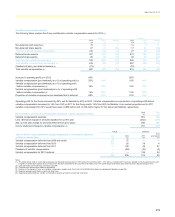
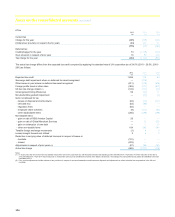
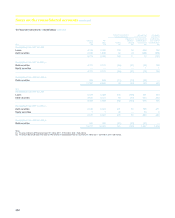
Main scheme All schemes
History of defined benefit schemes 2012
£m
2011
£m
2010
£m
2009
£m
2008
£m
2012
£m
2011
£m
2010
£m
2009
£m
2008
£m
Fair value of plan assets 22,441 21,111 19,110 16,603 14,80426,370 25,086 22,816 27,92525,756
Present value of defined benefit
obligations 25,648 22,955 21,09218,675 15,594 30,110 27,137 24,999 30,83027,752
Net deficit 3,207 1,844 1,9822,072 7903,740 2,051 2,183 2,9051,996
Experience (losses)/gains on plan
liabilities (232)(208) (858) 135 (55) (207) (200) (882)328 (65)
Experience gains/(losses) on plan
assets 210 759 1,718 993 (4,784) 373 636 1,797 1,344 (6,051)
Actual return/(loss) on pension
schemes assets 1,388 2,017 2,8322,022 (3,513) 1,763 2,124 3,225 2,897 (4,186)
Actual return/(loss) on pension
schemes assets - % 6.6% 10.6% 17.2%13.8% (19.0%) 7.1% 9.3% 15.6% 11.4% (14.5%)