RBS 2012 Annual Report Download - page 83
Download and view the complete annual report
Please find page 83 of the 2012 RBS annual report below. You can navigate through the pages in the report by either clicking on the pages listed below, or by using the keyword search tool below to find specific information within the annual report.-
 1
1 -
2
-
3
-
4
-
5
-
6
-
7
-
8
-
9
-
10
-
11
-
12
-
13
-
14
-
15
-
16
-
17
-
18
-
19
-
20
-
21
-
22
-
23
-
24
-
25
-
26
-
27
-
28
-
29
-
30
-
31
-
32
-
33
-
34
-
35
-
36
-
37
-
38
-
39
-
40
-
41
-
42
-
43
-
44
-
45
-
46
-
47
-
48
-
49
-
50
-
51
-
52
-
53
-
54
-
55
-
56
-
57
-
58
-
59
-
60
-
61
-
62
-
63
-
64
-
65
-
66
-
67
-
68
-
69
-
70
-
71
-
72
-
 73
73 -
 74
74 -
 75
75 -
 76
76 -
 77
77 -
 78
78 -
 79
79 -
 80
80 -
 81
81 -
 82
82 -
 83
83 -
 84
84 -
 85
85 -
 86
86 -
 87
87 -
 88
88 -
 89
89 -
 90
90 -
 91
91 -
 92
92 -
 93
93 -
94
-
95
-
96
-
97
-
98
-
99
-
100
-
101
-
102
-
103
-
104
-
105
-
106
-
107
-
108
-
109
-
110
-
111
-
112
-
113
-
114
-
115
-
116
-
117
-
118
-
119
-
120
-
121
-
122
-
123
-
124
-
125
-
126
-
127
-
128
-
129
-
130
-
131
-
132
-
133
-
134
-
135
-
136
-
137
-
138
-
139
-
140
-
141
-
142
-
143
-
144
-
145
-
146
-
147
-
148
-
149
-
150
-
151
-
152
-
153
-
154
-
155
-
156
-
157
-
158
-
159
-
160
-
161
-
162
-
163
-
164
-
165
-
166
-
167
-
168
-
169
-
170
-
171
-
172
-
173
-
174
-
175
-
176
-
177
-
178
-
179
-
180
-
181
-
182
-
183
-
184
-
185
-
186
-
187
-
188
-
189
-
190
-
191
-
192
-
193
-
194
-
195
-
196
-
197
-
198
-
199
-
200
-
201
-
202
-
203
-
204
-
205
-
206
-
207
-
208
-
209
-
210
-
211
-
212
-
213
-
214
-
215
-
216
-
217
-
218
-
219
-
220
-
221
-
222
-
223
-
224
-
225
-
226
-
227
-
228
-
229
-
230
-
231
-
232
-
233
-
234
-
235
-
236
-
237
-
238
-
239
-
240
-
241
-
242
-
243
-
244
-
245
-
246
-
247
-
248
-
249
-
250
-
251
-
252
-
253
-
254
-
255
-
256
-
257
-
258
-
259
-
260
-
261
-
262
-
263
-
264
-
265
-
266
-
267
-
268
-
269
-
270
-
271
-
272
-
273
-
274
-
275
-
276
-
277
-
278
-
279
-
280
-
281
-
282
-
283
-
284
-
285
-
286
-
287
-
288
-
289
-
290
-
291
-
292
-
293
-
294
-
295
-
296
-
297
-
298
-
299
-
300
-
301
-
302
-
303
-
304
-
305
-
306
-
307
-
308
-
309
-
310
-
311
-
312
-
313
-
314
-
315
-
316
-
317
-
318
-
319
-
320
-
321
-
322
-
323
-
324
-
325
-
326
-
327
-
328
-
329
-
330
-
331
-
332
-
333
-
334
-
335
-
336
-
337
-
338
-
339
-
340
-
341
-
342
-
343
-
344
-
345
-
346
-
347
-
348
-
349
-
350
-
351
-
352
-
353
-
354
-
355
-
356
-
357
-
358
-
359
-
360
-
361
-
362
-
363
-
364
-
365
-
366
-
367
-
368
-
369
-
370
-
371
-
372
-
373
-
374
-
375
-
376
-
377
-
378
-
379
-
380
-
381
-
382
-
383
-
384
-
385
-
386
-
387
-
388
-
389
-
390
-
391
-
392
-
393
-
394
-
395
-
396
-
397
-
398
-
399
-
400
-
401
-
402
-
403
-
404
-
405
-
406
-
407
-
408
-
409
-
410
-
411
-
412
-
413
-
414
-
415
-
416
-
417
-
418
-
419
-
420
-
421
-
422
-
423
-
424
-
425
-
426
-
427
-
428
-
429
-
430
-
431
-
432
-
433
-
434
-
435
-
436
-
437
-
438
-
439
-
440
-
441
-
442
-
443
-
444
-
445
-
446
-
447
-
448
-
449
-
450
-
451
-
452
-
453
-
454
-
455
-
456
-
457
-
458
-
459
-
460
-
461
-
462
-
463
-
464
-
465
-
466
-
467
-
468
-
469
-
470
-
471
-
472
-
473
-
474
-
475
-
476
-
477
-
478
-
479
-
480
-
481
-
482
-
483
-
484
-
485
-
486
-
487
-
488
-
489
-
490
-
491
-
492
-
493
-
494
-
495
-
496
-
497
-
498
-
499
-
500
-
501
-
502
-
503
-
504
-
505
-
506
-
507
-
508
-
509
-
510
-
511
-
512
-
513
-
514
-
515
-
516
-
517
-
518
-
519
-
520
-
521
-
522
-
523
-
524
-
525
-
526
-
527
-
528
-
529
-
530
-
531
-
532
-
533
-
534
-
535
-
536
-
537
-
538
-
539
-
540
-
541
-
542
-
543
 |
 |

RBS GROUP 2012
81
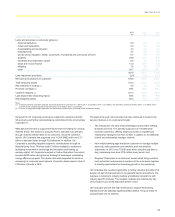
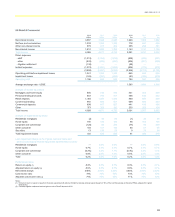
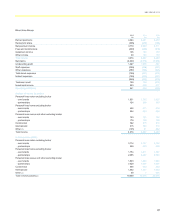
US Retail & Commercial
2012 2011 2010 2012 2011 2010
US$m US$mUS$m £m £m £m
Net interest income 3,087 3,048 2,940 1,948 1,900 1,902
Net fees and commissions 1,233 1,350 1,328 778 841 859
Other non-interest income 579 473 464 365 296 301
Non-interest income 1,812 1,823 1,792 1,143 1,137 1,160
Total income 4,899 4,871 4,732 3,091 3,037 3,062
Direct expenses
- staff (1,313) (1,344) (1,238) (828) (838) (801)
- other (833) (893) (897) (526) (557) (580)
- litigation settlement (138) —— (88) — —
Indirect expenses (1,274) (1,250) (1,255) (804) (779) (813)
(3,558) (3,487) (3,390) (2,246) (2,174) (2,194)
Operating profit before impairment losses 1,341 1,384 1,342 845 863 868
Impairment losses (145) (524) (802) (91) (326) (519)
Operating profit 1,196 860 540 754 537 349
Average exchange rate - US$/£ 1.585 1.604 1.546
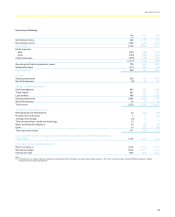
Analysis of income by product
Mortgages and home equity 856 744 786 541 463 509
Personal lending and cards 643 709 761 405 442 492
Retail deposits 1,364 1,487 1,465 860 927 948
Commercial lending 965 936 901 609 584 583
Commercial deposits 698 667 627 441 416 406
Other 373 328 192 235 205 124
Total income 4,899 4,871 4,732 3,091 3,037 3,062
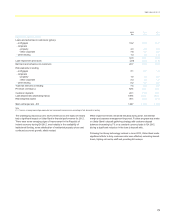
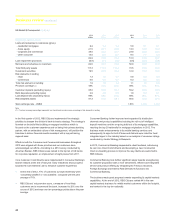
Analysis of impairments by sector
Residential mortgages (2) 44 85 (1) 28 55
Home equity 150 165 164 95 103 106
Corporate and commercial (120) 88 354 (77) 55 228
Other consumer 104
101 146 65 61 96
Securities 13 126 53 9 79 34
Total impairment losses 145 524 802 91 326 519
Loan impairment charge as % of gross customer loans and
advances (excluding reverse repurchase agreements) by sector
Residential mortgages — 0.5%0.9% — 0.5% 0.9%
Home equity 0.7% 0.7%0.7% 0.7% 0.7% 0.7%
Corporate and commercial (0.3%)0.2%1.1% (0.3%)0.2% 1.1%
Other consumer 0.8% 0.8%1.4% 0.8% 0.8% 1.4%
Total 0.2% 0.5%1.0% 0.2% 0.5% 1.0%
Performance ratios
Return on equity (1) 8.3% 6.3%3.7% 8.3% 6.3% 3.7%
Adjusted return on equity (2) 8.9% 6.3%3.7% 8.9% 6.3% 3.7%
Net interest margin 3.00% 3.06%2.82% 3.00% 3.06% 2.82%
Cost:income ratio 73% 72%72% 73% 72% 72%
Adjusted cost:income ratio (2) 71% 72%72% 71% 72% 72%
Notes:
(1) Divisional return on equity is based on divisional operating profit after tax divided by average notional equity (based on 10% of the monthly average of divisional RWAs, adjusted for capital
deductions).
(2) Excludes litigation settlement and net gain on sale of Visa B shares in 2012.