RBS 2012 Annual Report Download - page 490
Download and view the complete annual report
Please find page 490 of the 2012 RBS annual report below. You can navigate through the pages in the report by either clicking on the pages listed below, or by using the keyword search tool below to find specific information within the annual report.-
 1
1 -
2
-
3
-
4
-
5
-
6
-
7
-
8
-
9
-
10
-
11
-
12
-
13
-
14
-
15
-
16
-
17
-
18
-
19
-
20
-
21
-
22
-
23
-
24
-
25
-
26
-
27
-
28
-
29
-
30
-
31
-
32
-
33
-
34
-
35
-
36
-
37
-
38
-
39
-
40
-
41
-
42
-
43
-
44
-
45
-
46
-
47
-
48
-
49
-
50
-
51
-
52
-
53
-
54
-
55
-
56
-
57
-
58
-
59
-
60
-
61
-
62
-
63
-
64
-
65
-
66
-
67
-
68
-
69
-
70
-
71
-
72
-
73
-
74
-
75
-
76
-
77
-
78
-
79
-
80
-
81
-
82
-
83
-
84
-
85
-
86
-
87
-
88
-
89
-
90
-
91
-
92
-
93
-
94
-
95
-
96
-
97
-
98
-
99
-
100
-
101
-
102
-
103
-
104
-
105
-
106
-
107
-
108
-
109
-
110
-
111
-
112
-
113
-
114
-
115
-
116
-
117
-
118
-
119
-
120
-
121
-
122
-
123
-
124
-
125
-
126
-
127
-
128
-
129
-
130
-
131
-
132
-
133
-
134
-
135
-
136
-
137
-
138
-
139
-
140
-
141
-
142
-
143
-
144
-
145
-
146
-
147
-
148
-
149
-
150
-
151
-
152
-
153
-
154
-
155
-
156
-
157
-
158
-
159
-
160
-
161
-
162
-
163
-
164
-
165
-
166
-
167
-
168
-
169
-
170
-
171
-
172
-
173
-
174
-
175
-
176
-
177
-
178
-
179
-
180
-
181
-
182
-
183
-
184
-
185
-
186
-
187
-
188
-
189
-
190
-
191
-
192
-
193
-
194
-
195
-
196
-
197
-
198
-
199
-
200
-
201
-
202
-
203
-
204
-
205
-
206
-
207
-
208
-
209
-
210
-
211
-
212
-
213
-
214
-
215
-
216
-
217
-
218
-
219
-
220
-
221
-
222
-
223
-
224
-
225
-
226
-
227
-
228
-
229
-
230
-
231
-
232
-
233
-
234
-
235
-
236
-
237
-
238
-
239
-
240
-
241
-
242
-
243
-
244
-
245
-
246
-
247
-
248
-
249
-
250
-
251
-
252
-
253
-
254
-
255
-
256
-
257
-
258
-
259
-
260
-
261
-
262
-
263
-
264
-
265
-
266
-
267
-
268
-
269
-
270
-
271
-
272
-
273
-
274
-
275
-
276
-
277
-
278
-
279
-
280
-
281
-
282
-
283
-
284
-
285
-
286
-
287
-
288
-
289
-
290
-
291
-
292
-
293
-
294
-
295
-
296
-
297
-
298
-
299
-
300
-
301
-
302
-
303
-
304
-
305
-
306
-
307
-
308
-
309
-
310
-
311
-
312
-
313
-
314
-
315
-
316
-
317
-
318
-
319
-
320
-
321
-
322
-
323
-
324
-
325
-
326
-
327
-
328
-
329
-
330
-
331
-
332
-
333
-
334
-
335
-
336
-
337
-
338
-
339
-
340
-
341
-
342
-
343
-
344
-
345
-
346
-
347
-
348
-
349
-
350
-
351
-
352
-
353
-
354
-
355
-
356
-
357
-
358
-
359
-
360
-
361
-
362
-
363
-
364
-
365
-
366
-
367
-
368
-
369
-
370
-
371
-
372
-
373
-
374
-
375
-
376
-
377
-
378
-
379
-
380
-
381
-
382
-
383
-
384
-
385
-
386
-
387
-
388
-
389
-
390
-
391
-
392
-
393
-
394
-
395
-
396
-
397
-
398
-
399
-
400
-
401
-
402
-
403
-
404
-
405
-
406
-
407
-
408
-
409
-
410
-
411
-
412
-
413
-
414
-
415
-
416
-
417
-
418
-
419
-
420
-
421
-
422
-
423
-
424
-
425
-
426
-
427
-
428
-
429
-
430
-
431
-
432
-
433
-
434
-
435
-
436
-
437
-
438
-
439
-
440
-
441
-
442
-
443
-
444
-
445
-
446
-
447
-
448
-
449
-
450
-
451
-
452
-
453
-
454
-
455
-
456
-
457
-
458
-
459
-
460
-
461
-
462
-
463
-
464
-
465
-
466
-
467
-
468
-
469
-
470
-
471
-
472
-
473
-
474
-
475
-
476
-
477
-
478
-
479
-
 480
480 -
 481
481 -
 482
482 -
 483
483 -
 484
484 -
 485
485 -
 486
486 -
 487
487 -
 488
488 -
 489
489 -
 490
490 -
 491
491 -
 492
492 -
 493
493 -
 494
494 -
 495
495 -
 496
496 -
 497
497 -
 498
498 -
 499
499 -
 500
500 -
501
-
502
-
503
-
504
-
505
-
506
-
507
-
508
-
509
-
510
-
511
-
512
-
513
-
514
-
515
-
516
-
517
-
518
-
519
-
520
-
521
-
522
-
523
-
524
-
525
-
526
-
527
-
528
-
529
-
530
-
531
-
532
-
533
-
534
-
535
-
536
-
537
-
538
-
539
-
540
-
541
-
542
-
543
 |
 |

488
Additional information
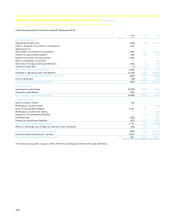
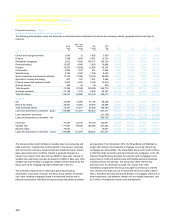
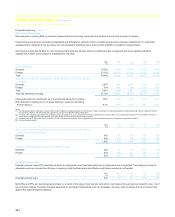
Financial summary
The Group's financial statements are prepared in accordance with IFRS. Selected data under IFRS for each of the five years ended 31 December 2012
are presented below.
Summary consolidated income statement 2012
£m
2011
£m
2010
£m
2009
£m
2008
£m
Net interest income 11,402 12,303 13,782 12,928 14,847
Non-interest income (1,2,3) 6,539 12,348 12,840 14,650 330
Total income 17,941 24,651 26,622 27,578 15,177
Operating expenses (4,5,6,7,8) (17,827) (17,134) (17,456) (16,569) (34,051)
Profit/(loss) before insurance net claims and impairment losses 114 7,517 9,166 11,009 (18,874)
Insurance net claims — — (85) (134) (184)
Impairment losses (9) (5,279) (8,707) (9,235) (13,891) (7,397)
Operating loss before tax (5,165) (1,190) (154) (3,016) (26,455)
Tax (charge)/credit (469) (1,127) (703) 490 2,388
Loss from continuing operations (5,634) (2,317) (857) (2,526) (24,067)
(Loss)/profit from discontinued operations, net of tax (172) 348 (809) 203 (10,475)
Loss for the year (5,806) (1,969) (1,666) (2,323) (34,542)
Loss attributable to:
Non-controlling interests (123) 28 (665) 349 (10,832)
Preference shareholders 273 — 105 878 536
Paid-in equity holders 15 — 19 57 60
Ordinary and B shareholders (5,971) (1,997) (1,125) (3,607) (24,306)
Notes:
(1) Includes profit on strategic disposals of £113 million (2011 - £24 million loss; 2010 - £171 million profit; 2009 - £82 million loss; 2008 - £442 million profit).
(2) Includes gain on redemption of own debt of £454 million (2011 - £255 million; 2010 - £553 million; 2009 - £3,790 million).
(3) Includes own credit adjustments of £4,649 million loss (2011 - £1,914 million gain; 2010 - £242 million gain; 2009 - £97 million loss; 2008 - £1,232 million gain).
(4) Includes Payment Protection Insurance costs of £1,110 million (2011 - £850 million), Interest Rate Hedging Products redress and related costs of £700 million and regulatory fines of £381 million.
(5) Includes integration and restructuring costs of £1,415 million (2011 - £1,021 million; 2010 - £1,012 million; 2009 - £1,276 million; 2008 - £1,348 million).
(6) Includes amortisation of purchased intangible assets of £177 million (2011 - £222 million; 2010 - £369 million; 2009 - £272 million; 2008 - £443 million).
(7) Includes write-down of goodwill and other intangible assets of £124 million (2011 - £80 million; 2010 - £1 million; 2009 - £296 million; 2008 - £16,869 million).
(8) Includes gains on pensions curtailment of £2,148 million in 2009.
(9) Includes sovereign debt impairment of £1,099 million and related interest rate hedge adjustments of £169 million in 2011.
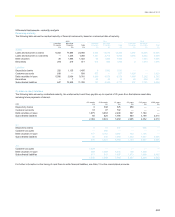
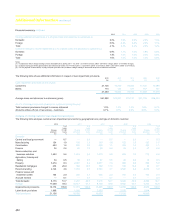
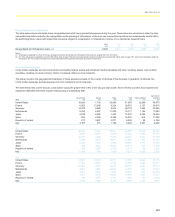
Summary consolidated balance sheet 2012
£m
2011
£m
2010
£m
2009
£m
2008
£m
Loans and advances 564,086 598,916 655,778 820,146 1,012,919
Debt securities and equity shares 172,670 224,263 239,678 286,782 293,879
Derivatives and settlement balances 447,644 537,389 438,682 453,487 1,010,391
Other assets 127,895 146,299 119,438 136,071 84,463
Total assets 1,312,295 1,506,867 1,453,576 1,696,486 2,401,652
Owners' equity 68,130 74,819 75,132 77,736 58,879
Non-controlling interests 2,318 1,234 1,719 16,895 21,619
Subordinated liabilities 26,773 26,319 27,053 37,652 49,154
Deposits 622,684 611,759 609,483 756,346 897,556
Derivatives, settlement balances and short positions 467,802 572,499 478,076 475,017 1,025,641
Other liabilities 124,588 220,237 262,113 332,840 348,803
Total liabilities and equity 1,312,295 1,506,867 1,453,576 1,696,486 2,401,652