RBS 2014 Annual Report Download - page 13
Download and view the complete annual report
Please find page 13 of the 2014 RBS annual report below. You can navigate through the pages in the report by either clicking on the pages listed below, or by using the keyword search tool below to find specific information within the annual report.-
 1
1 -
2
-
 3
3 -
 4
4 -
 5
5 -
 6
6 -
 7
7 -
 8
8 -
 9
9 -
 10
10 -
 11
11 -
 12
12 -
 13
13 -
 14
14 -
 15
15 -
 16
16 -
 17
17 -
 18
18 -
 19
19 -
 20
20 -
 21
21 -
 22
22 -
 23
23 -
24
-
25
-
26
-
27
-
28
-
29
-
30
-
31
-
32
-
33
-
34
-
35
-
36
-
37
-
38
-
39
-
40
-
41
-
42
-
43
-
44
-
45
-
46
-
47
-
48
-
49
-
50
-
51
-
52
-
53
-
54
-
55
-
56
-
57
-
58
-
59
-
60
-
61
-
62
-
63
-
64
-
65
-
66
-
67
-
68
-
69
-
70
-
71
-
72
-
73
-
74
-
75
-
76
-
77
-
78
-
79
-
80
-
81
-
82
-
83
-
84
-
85
-
86
-
87
-
88
-
89
-
90
-
91
-
92
-
93
-
94
-
95
-
96
-
97
-
98
-
99
-
100
-
101
-
102
-
103
-
104
-
105
-
106
-
107
-
108
-
109
-
110
-
111
-
112
-
113
-
114
-
115
-
116
-
117
-
118
-
119
-
120
-
121
-
122
-
123
-
124
-
125
-
126
-
127
-
128
-
129
-
130
-
131
-
132
-
133
-
134
-
135
-
136
-
137
-
138
-
139
-
140
-
141
-
142
-
143
-
144
-
145
-
146
-
147
-
148
-
149
-
150
-
151
-
152
-
153
-
154
-
155
-
156
-
157
-
158
-
159
-
160
-
161
-
162
-
163
-
164
-
165
-
166
-
167
-
168
-
169
-
170
-
171
-
172
-
173
-
174
-
175
-
176
-
177
-
178
-
179
-
180
-
181
-
182
-
183
-
184
-
185
-
186
-
187
-
188
-
189
-
190
-
191
-
192
-
193
-
194
-
195
-
196
-
197
-
198
-
199
 |
 |
11
RBS – Interim Results 2015
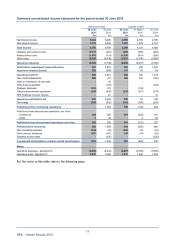
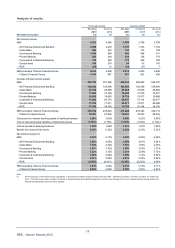
Summary consolidated income statement for the period ended 30 June 2015
Half year ended Quarter ended
30 June 30 June 30 June 31 March 30 June
2015 2014 2015 2015 2014
£m £m £m £m £m
Net interest income 5,522 5,496 2,766 2,756 2,798
Non-interest income 3,178 4,482 1,603 1,575 2,127
Total income 8,700 9,978 4,369 4,331 4,925
Litigation and conduct costs (1,315) (250) (459) (856) (250)
Restructuring costs (1,503) (514) (1,050) (453) (385)
Other costs (5,485) (6,344) (2,697) (2,788) (3,065)
Operating expenses (8,303) (7,108) (4,206) (4,097) (3,700)
Profit before impairment releases/(losses) 397 2,870 163 234 1,225
Impairment releases/(losses) 232 (269) 141 91 93
Operating profit (1) 629 2,601 304 325 1,318
Own credit adjustments 288 (51) 168 120 (190)
Gain on redemption of own debt - 20 - - -
Write down of goodwill - (130) - - (130)
Strategic disposals (135) 191 - (135) -
Citizens discontinued operations (489) (426) (232) (257) (274)
RFS Holdings minority interest - 21 - - 12
Operating profit before tax 293 2,226 240 53 736
Tax charge (293) (592) (100) (193) (278)
Profit/(loss) from continuing operations - 1,634 140 (140) 458
Profit/(loss) from discontinued operations, net of tax
- Citizens (2) 354 285 674 (320) 181
- Other 4 35 - 4 26
Profit/(loss) from discontinued operations net of tax 358 320 674 (316) 207
Profit/(loss) for the period 358 1,954 814 (456) 665
Non-controlling interests (344) (42) (428) 84 (23)
Other owners’ dividends (167) (167) (93) (74) (92)
Dividend access share - (320) - - (320)
(Loss)/profit attributable to ordinary and B shareholders (153) 1,425 293 (446) 230
Memo:
Operating expenses - adjusted (3) (5,485) (6,344) (2,697) (2,788) (3,065)
Operating profit - adjusted (3) 3,447 3,365 1,813 1,634 1,953
For the notes to this table refer to the following page.