RBS 2014 Annual Report Download - page 32
Download and view the complete annual report
Please find page 32 of the 2014 RBS annual report below. You can navigate through the pages in the report by either clicking on the pages listed below, or by using the keyword search tool below to find specific information within the annual report.-
 1
1 -
2
-
3
-
4
-
5
-
6
-
7
-
8
-
9
-
10
-
11
-
12
-
13
-
14
-
15
-
16
-
17
-
18
-
19
-
20
-
21
-
 22
22 -
 23
23 -
 24
24 -
 25
25 -
 26
26 -
 27
27 -
 28
28 -
 29
29 -
 30
30 -
 31
31 -
 32
32 -
 33
33 -
 34
34 -
 35
35 -
 36
36 -
 37
37 -
 38
38 -
 39
39 -
 40
40 -
 41
41 -
 42
42 -
43
-
44
-
45
-
46
-
47
-
48
-
49
-
50
-
51
-
52
-
53
-
54
-
55
-
56
-
57
-
58
-
59
-
60
-
61
-
62
-
63
-
64
-
65
-
66
-
67
-
68
-
69
-
70
-
71
-
72
-
73
-
74
-
75
-
76
-
77
-
78
-
79
-
80
-
81
-
82
-
83
-
84
-
85
-
86
-
87
-
88
-
89
-
90
-
91
-
92
-
93
-
94
-
95
-
96
-
97
-
98
-
99
-
100
-
101
-
102
-
103
-
104
-
105
-
106
-
107
-
108
-
109
-
110
-
111
-
112
-
113
-
114
-
115
-
116
-
117
-
118
-
119
-
120
-
121
-
122
-
123
-
124
-
125
-
126
-
127
-
128
-
129
-
130
-
131
-
132
-
133
-
134
-
135
-
136
-
137
-
138
-
139
-
140
-
141
-
142
-
143
-
144
-
145
-
146
-
147
-
148
-
149
-
150
-
151
-
152
-
153
-
154
-
155
-
156
-
157
-
158
-
159
-
160
-
161
-
162
-
163
-
164
-
165
-
166
-
167
-
168
-
169
-
170
-
171
-
172
-
173
-
174
-
175
-
176
-
177
-
178
-
179
-
180
-
181
-
182
-
183
-
184
-
185
-
186
-
187
-
188
-
189
-
190
-
191
-
192
-
193
-
194
-
195
-
196
-
197
-
198
-
199
 |
 |

30
RBS – Interim Results 2015
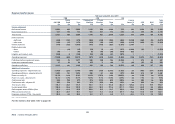
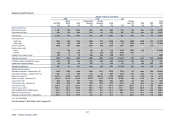
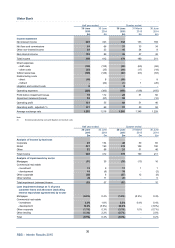
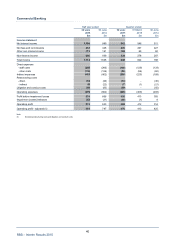
Segment performance
Quarter ended 30 June 2014
PBB CPB CIB
Ulste
r
Commercial Private Central Total
UK PBB Bank Total Banking Banking Total items (1) CFG RCR RBS
£m £m £m £m £m £m £m £m £m £m £m
Income statement
Net interest income 1,152 169 1,321 511 174 685 186 100 499 7 2,798
Non-interest income 347 42 389 287 98 385 890 44 391 28 2,127
Total income 1,499 211 1,710 798 272 1,070 1,076 144 890 35 4,925
Direct expenses
- staff costs (235) (62) (297) (133) (75) (208) (217) (659) (261) (51) (1,693)
- other costs (95) (18) (113) (60) (14) (74) (140) (779) (252) (14) (1,372)
Indirect expenses (446) (63) (509) (189) (109) (298) (587) 1,426 - (32) -
Restructuring costs
- direct (6) 8 2 (40) (2) (42) (9) (267) (69) - (385)
- indirect (23) (20) (43) (21) (1) (22) (143) 208 - - -
Litigation and conduct costs (150) - (150) (50) - (50) (50) - - - (250)
Operating expenses (955) (155) (1,110) (493) (201) (694) (1,146) (71) (582) (97) (3,700)
Profit/(loss) before impairment losses 544 56 600 305 71 376 (70) 73 308 (62) 1,225
Impairment (losses)/releases (60) (10) (70) 9 (1) 8 45 13 (31) 128 93
Operating profit/(loss) 484 46 530 314 70 384 (25) 86 277 66 1,318
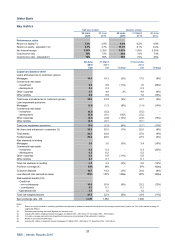
Additional information
Operating expenses - adjusted (£m) (2) (776) (143) (919) (382) (198) (580) (944) (12) (513) (97) (3,065)
Operating profit - adjusted (£m) (2) 663 58 721 425 73 498 177 145 346 66 1,953
Return on equity (3) 21.6% 4.9% 15.8% 9.3% 12.3% 9.7% (1.5%) nm 9.0% nm 2.2%
Return on equity - adjusted (2,3) 29.9% 6.2% 21.8% 12.9% 12.8% 12.9% 1.9% nm 11.2% nm 6.8%
Cost:income ratio 64% 73% 65% 62% 74% 65% 107% nm 65% nm 75%
Cost:income ratio - adjusted (2) 52% 68% 54% 48% 73% 54% 88% nm 58% nm 62%
Total assets (£bn) 133.6 26.7 160.3 88.6 20.8 109.4 537.6 93.3 76.1 34.4 1,011.1
Funded assets (£bn) 133.6 26.6 160.2 88.6 20.8 109.4 278.7 91.3 75.7 20.9 736.2
Risk-weighted assets (£bn) 47.0 27.7 74.7 63.0 11.8 74.8 127.8 19.0 60.7 35.1 392.1
RWA equivalent (£bn) (4) 48.8 23.0 71.8 69.2 11.8 81.0 129.8 19.3 60.7 43.5 406.1
Employee numbers (FTEs - thousands) 25.1 4.5 29.6 7.1 3.4 10.5 4.3 50.6 17.7 0.9 113.6
nm = not meaningful
Notes:
(1) Central items include unallocated transactions, principally Treasury AFS portfolio sales of £69 million loss in H1 2015 (H1 2014 - £215 million gain; Q2 2015 - £42 million loss; Q1 2015 - £27 million loss; Q2 2014 - £13 million gain) and profit and loss on hedges tha
t
do not qualify for hedge accounting.
(2) Excluding restructuring costs and litigation and conduct costs.
(3) Segmental return on equity based on operating profit after tax adjusted for preference share dividends divided by average notional equity (based on 13% of the monthly average RWA equivalents (RWAe)).
(4) RWAe is an internal metric based on target CET 1 ratio of 13%, for all segments except RCR, set at 10% at creation. RWAe converts performing and non-performing exposures into a consistent capital measure comprising RWAs and capital deductions.