RBS 2014 Annual Report Download - page 98
Download and view the complete annual report
Please find page 98 of the 2014 RBS annual report below. You can navigate through the pages in the report by either clicking on the pages listed below, or by using the keyword search tool below to find specific information within the annual report.-
 1
1 -
2
-
3
-
4
-
5
-
6
-
7
-
8
-
9
-
10
-
11
-
12
-
13
-
14
-
15
-
16
-
17
-
18
-
19
-
20
-
21
-
22
-
23
-
24
-
25
-
26
-
27
-
28
-
29
-
30
-
31
-
32
-
33
-
34
-
35
-
36
-
37
-
38
-
39
-
40
-
41
-
42
-
43
-
44
-
45
-
46
-
47
-
48
-
49
-
50
-
51
-
52
-
53
-
54
-
55
-
56
-
57
-
58
-
59
-
60
-
61
-
62
-
63
-
64
-
65
-
66
-
67
-
68
-
69
-
70
-
71
-
72
-
73
-
74
-
75
-
76
-
77
-
78
-
79
-
80
-
81
-
82
-
83
-
84
-
85
-
86
-
87
-
 88
88 -
 89
89 -
 90
90 -
 91
91 -
 92
92 -
 93
93 -
 94
94 -
 95
95 -
 96
96 -
 97
97 -
 98
98 -
 99
99 -
 100
100 -
 101
101 -
 102
102 -
 103
103 -
 104
104 -
 105
105 -
 106
106 -
 107
107 -
 108
108 -
109
-
110
-
111
-
112
-
113
-
114
-
115
-
116
-
117
-
118
-
119
-
120
-
121
-
122
-
123
-
124
-
125
-
126
-
127
-
128
-
129
-
130
-
131
-
132
-
133
-
134
-
135
-
136
-
137
-
138
-
139
-
140
-
141
-
142
-
143
-
144
-
145
-
146
-
147
-
148
-
149
-
150
-
151
-
152
-
153
-
154
-
155
-
156
-
157
-
158
-
159
-
160
-
161
-
162
-
163
-
164
-
165
-
166
-
167
-
168
-
169
-
170
-
171
-
172
-
173
-
174
-
175
-
176
-
177
-
178
-
179
-
180
-
181
-
182
-
183
-
184
-
185
-
186
-
187
-
188
-
189
-
190
-
191
-
192
-
193
-
194
-
195
-
196
-
197
-
198
-
199
 |
 |

96
RBS – Interim Results 2015
Notes
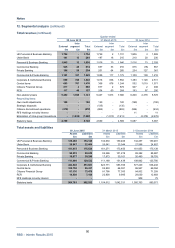
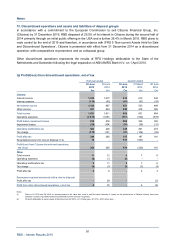
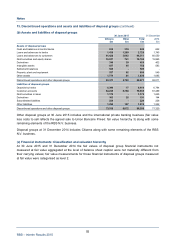
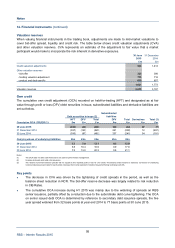
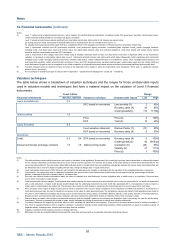
14. Financial instruments (continued)
Financial instruments carried at fair value - valuation hierarchy
Disclosures relating to the control environment, valuation techniques and related aspects pertaining to
financial instruments measured at fair value are included in the 2014 Annual Report and Accounts. There
have been no material changes to valuation or levelling approaches in the half year ended 30 June 2015.
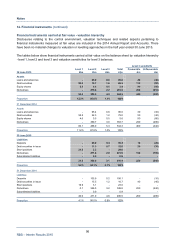
The tables below show financial instruments carried at fair value on the balance sheet by valuation hierarchy
- level 1, level 2 and level 3 and valuation sensitivities for level 3 balances.
Level 3 sensitivity
Level 1 Level 2 Level 3 Total Favourable Unfavourable
30 June 2015 £bn £bn £bn £bn £m £m
Assets
Loans and advances - 89.2 0.6 89.8 40 (40)
Debt securities 52.0 15.7 1.6 69.3 110 (50)
Equity shares 2.5 0.4 0.5 3.4 90 (80)
Derivatives - 279.6 2.2 281.8 200 (210)
54.5 384.9 4.9 444.3 440 (380)
Proportion 12.3% 86.6% 1.1% 100%
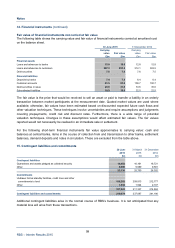
31 December 2014
A
ssets
Loans and advances - 95.4 0.6 96.0 30 (30)
Debt securities 55.5 22.3 1.2 79.0 50 (40)
Equity shares 4.6 0.5 0.5 5.6 90 (80)
Derivatives - 350.7 3.0 353.7 290 (290)
60.1 468.9 5.3 534.3 460 (440)
Proportion 11.2% 87.8% 1.0% 100%
30 June 2015
Liabilities
Deposits - 99.0 0.4 99.4 10 (20)
Debt securities in issue - 11.3 0.7 12.0 20 (30)
Short positions 21.3 3.3 - 24.6 - -
Derivatives - 271.6 2.0 273.6 190 (190)
Subordinated liabilities - 0.8 - 0.8 - -
21.3 386.0 3.1 410.4 220 (240)
Proportion 5.2% 94.1% 0.7% 100%
31 December 2014
Liabilities
Deposits - 105.9 0.2 106.1 - (10)
Debt securities in issue - 15.5 1.2 16.7 40 (40)
Short positions 19.9 3.1 - 23.0 - -
Derivatives 0.1 346.5 3.2 349.8 220 (240)
Subordinated liabilities - 0.9 - 0.9 - -
20.0 471.9 4.6 496.5 260 (290)
Proportion 4.1% 95.0% 0.9% 100%