RBS 2014 Annual Report Download - page 145
Download and view the complete annual report
Please find page 145 of the 2014 RBS annual report below. You can navigate through the pages in the report by either clicking on the pages listed below, or by using the keyword search tool below to find specific information within the annual report.-
 1
1 -
2
-
3
-
4
-
5
-
6
-
7
-
8
-
9
-
10
-
11
-
12
-
13
-
14
-
15
-
16
-
17
-
18
-
19
-
20
-
21
-
22
-
23
-
24
-
25
-
26
-
27
-
28
-
29
-
30
-
31
-
32
-
33
-
34
-
35
-
36
-
37
-
38
-
39
-
40
-
41
-
42
-
43
-
44
-
45
-
46
-
47
-
48
-
49
-
50
-
51
-
52
-
53
-
54
-
55
-
56
-
57
-
58
-
59
-
60
-
61
-
62
-
63
-
64
-
65
-
66
-
67
-
68
-
69
-
70
-
71
-
72
-
73
-
74
-
75
-
76
-
77
-
78
-
79
-
80
-
81
-
82
-
83
-
84
-
85
-
86
-
87
-
88
-
89
-
90
-
91
-
92
-
93
-
94
-
95
-
96
-
97
-
98
-
99
-
100
-
101
-
102
-
103
-
104
-
105
-
106
-
107
-
108
-
109
-
110
-
111
-
112
-
113
-
114
-
115
-
116
-
117
-
118
-
119
-
120
-
121
-
122
-
123
-
124
-
125
-
126
-
127
-
128
-
129
-
130
-
131
-
132
-
133
-
134
-
 135
135 -
 136
136 -
 137
137 -
 138
138 -
 139
139 -
 140
140 -
 141
141 -
 142
142 -
 143
143 -
 144
144 -
 145
145 -
 146
146 -
 147
147 -
 148
148 -
 149
149 -
 150
150 -
 151
151 -
 152
152 -
 153
153 -
 154
154 -
 155
155 -
156
-
157
-
158
-
159
-
160
-
161
-
162
-
163
-
164
-
165
-
166
-
167
-
168
-
169
-
170
-
171
-
172
-
173
-
174
-
175
-
176
-
177
-
178
-
179
-
180
-
181
-
182
-
183
-
184
-
185
-
186
-
187
-
188
-
189
-
190
-
191
-
192
-
193
-
194
-
195
-
196
-
197
-
198
-
199
 |
 |

10
RBS – Interim Results 2015
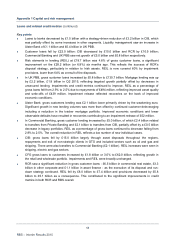
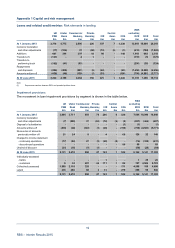
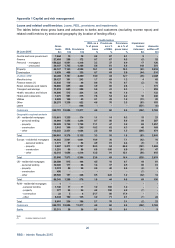
Appendix 1 Capital and risk management
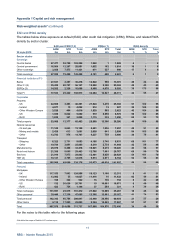
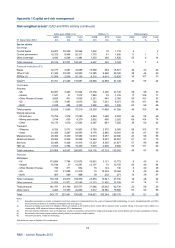
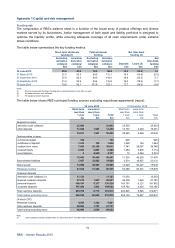
Risk-weighted assets* (continued)
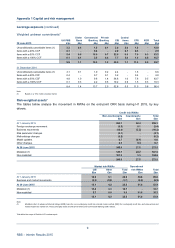
The table below analyses the movement in end-point CRR RWAs by segment during the half year.
Ulste
r
Commercial Private Central
UK PBB Bank Banking Banking CIB items CFG RC
R
Total
Total RWAs £bn £bn £bn £bn £bn £bn £bn £bn £bn
A
t 1 January 2015 42.8 23.8 64.0 11.5 107.1 16.3 68.4 22.0 355.9
Foreign exchange movement - (1.5) (0.3) 0.1 (1.0) - (0.3) (0.4) (3.4)
Business movements (0.6) (0.4) 1.1 (0.8) (18.3) (0.6) 1.7 (5.2) (23.1)
Risk parameter changes (1) (1.3) (0.7) (0.2) - 0.3 (0.2) - (2.0) (4.1)
Methodology changes (2) - - (0.2) - -- - -(0.2)
Model updates (3) (0.2) - - - 1.4 (0.6) - -0.6
Other changes 0.3 - 2.5 (1.0) (1.5) 0.4 - -0.7
At 30 June 2015 41.0 21.2 66.9 9.8 88.0 15.3 69.8 14.4 326.4
Credit risk
- non-counterparty 32.0 19.6 60.7 8.2 38.6 14.1 64.0 7.8 245.0
- counterparty - 0.1 - - 22.9 0.6 0.9 3.0 27.5
Market risk - - - 0.1 18.1 0.1 - 4.0 22.3
Operational risk 9.0 1.5 6.2 1.5 8.4 0.5 4.9 (0.4) 31.6
Total RWAs 41.0 21.2 66.9 9.8 88.0 15.3 69.8 14.4 326.4
Key points
• RWAs fell by £29.5 billion to £326.4 billion in the first half of 2015 principally in CIB and RCR.
• CIB reduced RWAs by £19 billion to £88 billion in line with expected business run-off as it implemented
the new strategy. These reductions included:
○ regional loan portfolio disposals and run-offs (£6.8 billion), including US corporate loan portfolio
sales to Mizuho (£3.2 billion);
○ US asset-backed product exit (£2.3 billion);
○ other trading portfolio disposals (£2.1 billion);
○ restructuring of certain derivative transactions (£1.7 billion); and
○ run down of the trade finance in GTS in line with contractual maturities (£3.2 billion).
• RCR disposal and run-off strategy continued to progress, resulting in RWA reductions of £7.6 billion.
• Improvements in credit quality metrics contributed to RWA decreases in Ulster Bank and UK PBB.
• Sterling strengthening against the euro and US dollar resulted in lower RWAs in Ulster Bank and CIB.
• Commercial Banking RWAs at 30 June 2015 included the transfer of UK Corporate coverage from CIB
(£2.3 billion) and Private Banking RBSI (£1.5 billion).
•
A
nnual recalculation of operational risk resulted in a £5.2 billion RWA reduction, primarily £3.4 billion in
CIB and £0.4 billion in both UK PBB and Private Banking.
• In terms of RWA density for AIRB portfolios:
○ other sovereign density decreased from 25% to 17% following the sale of term loans in RCR;
○ non-bank financial institution density increased from 38% to 45% primarily reflecting close-out of a
large low risk-weighted exposure and implementation of new LGD and PD models;
○ commercial property RWA density increased overall principally due to the impact of RCR disposals,
including defaulted assets; and
○ the increase in RWA density for oil and gas and mining and metal sectors reflected implementation
of the new large corporate PD model for mining exposures.
*Not within the scope of Deloitte LLP’s review report