RBS 2014 Annual Report Download - page 176
Download and view the complete annual report
Please find page 176 of the 2014 RBS annual report below. You can navigate through the pages in the report by either clicking on the pages listed below, or by using the keyword search tool below to find specific information within the annual report.-
 1
1 -
2
-
3
-
4
-
5
-
6
-
7
-
8
-
9
-
10
-
11
-
12
-
13
-
14
-
15
-
16
-
17
-
18
-
19
-
20
-
21
-
22
-
23
-
24
-
25
-
26
-
27
-
28
-
29
-
30
-
31
-
32
-
33
-
34
-
35
-
36
-
37
-
38
-
39
-
40
-
41
-
42
-
43
-
44
-
45
-
46
-
47
-
48
-
49
-
50
-
51
-
52
-
53
-
54
-
55
-
56
-
57
-
58
-
59
-
60
-
61
-
62
-
63
-
64
-
65
-
66
-
67
-
68
-
69
-
70
-
71
-
72
-
73
-
74
-
75
-
76
-
77
-
78
-
79
-
80
-
81
-
82
-
83
-
84
-
85
-
86
-
87
-
88
-
89
-
90
-
91
-
92
-
93
-
94
-
95
-
96
-
97
-
98
-
99
-
100
-
101
-
102
-
103
-
104
-
105
-
106
-
107
-
108
-
109
-
110
-
111
-
112
-
113
-
114
-
115
-
116
-
117
-
118
-
119
-
120
-
121
-
122
-
123
-
124
-
125
-
126
-
127
-
128
-
129
-
130
-
131
-
132
-
133
-
134
-
135
-
136
-
137
-
138
-
139
-
140
-
141
-
142
-
143
-
144
-
145
-
146
-
147
-
148
-
149
-
150
-
151
-
152
-
153
-
154
-
155
-
156
-
157
-
158
-
159
-
160
-
161
-
162
-
163
-
164
-
165
-
 166
166 -
 167
167 -
 168
168 -
 169
169 -
 170
170 -
 171
171 -
 172
172 -
 173
173 -
 174
174 -
 175
175 -
 176
176 -
 177
177 -
 178
178 -
 179
179 -
 180
180 -
 181
181 -
 182
182 -
 183
183 -
 184
184 -
 185
185 -
 186
186 -
187
-
188
-
189
-
190
-
191
-
192
-
193
-
194
-
195
-
196
-
197
-
198
-
199
 |
 |

41
RBS – Interim Results 2015
Appendix 1 Capital and risk management
Key points* (continued)
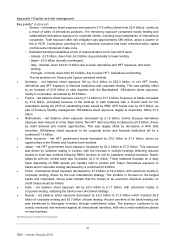
○ Greece - net balance sheet exposure decreased to £110 million (down from £0.4 billion), mostly as
a result of sales of derivatives positions. The remaining exposure comprised mostly lending and
collateralised derivatives exposure to corporate clients, including local subsidiaries of international
companies. Total exposure after risk mitigation was approximately £86 million, about a quarter o
f
this in RCR. Contingency planning for any downside scenarios had been refreshed when capital
controls were introduced in late June.
○ Estimated funding mismatches at risk of redenomination at 30 June 2015 were:
- Ireland - £3.5 billion, down from £4.0 billion, due principally to lower lending.
- Spain - £0.5 billion (broadly unchanged).
- Italy - minimal, down from £1.5 billion due to lower derivatives and HFT exposure, and lower
lending.
- Portugal - minimal, down from £0.5 billion, due to lower HFT, derivatives and lending.
The net positions for Greece and Cyprus remained minimal.
• Germany - net balance sheet exposure fell by £4.3 billion to £22.3 billion, in net HFT bonds,
derivatives and SFT exposure to financial institutions and corporate lending. This was partially offse
t
by an increase of £3.9 billion in cash deposits with the Bundesbank. Off-balance sheet exposure,
mostly to corporates, decreased by £0.9 billion.
• France - net balance sheet exposure rose by £1.3 billion to £17.4 billion. Exposure to banks increased
by £1.0 billion, principally because of the build-up of cash balances with a French bank for the
redemption during Q3 2015 of outstanding notes issued by RBS. AFS bonds rose by £0.5 billion, as
part of Treasury liquidity management. Off-balance sheet exposure, largely to corporates, fell by £1.0
billion.
• Netherlands - net balance sheet exposure decreased by £1.8 billion, mainly because derivatives
exposure was reduced to a few major banks. Net HFT debt securities increased by £0.8 billion, driven
by client demand and market opportunities. This was largely offset by decreases in AFS debt
securities. Off-balance sheet exposure to the corporate sector and financial institutions fell by a
combined £1.4 billion.
• Other eurozone - net HFT government bonds increased by £0.5 billion to £1.4 billion, driven by
opportunities in the Finnish and Austrian bond markets.
• Japan - net HFT government bond exposure increased by £4.2 billion to £7.2 billion. This exposure
was driven by collateral trading in London, with the increase in outright holdings reflecting reduced
access to local repo markets following RBS’s decision to exit its Japanese onshore business. Nostro
balances with the central bank also increased, by £1.0 billion. These balances fluctuate on a daily
basis depending on RBS excess yen liquidity held in London and Tokyo. Derivatives exposure to
banks and in corporate lending decreased by a combined £0.8 billion.
• China - net balance sheet exposure decreased by £1.2 billion to £2.4 billion, with reductions mostly in
corporate lending, driven by the new international strategy. The portfolio is focused on the larges
t
banks and corporates. Stress tests indicate that the impact of an economic downturn scenario on
credit losses would be limited.
• India - net balance sheet exposure fell by £0.3 billion to £1.7 billion, with reductions mostly in
corporate lending, reflecting the bank’s new UK-centred strategy.
• Russia - net balance sheet exposure decreased by £0.2 billion to £1.6 billion which included £0.9
billion of corporate lending and £0.7 billion of bank lending. Around one-third of the bank lending risk
was transferred to third-party investors through credit-linked notes. The exposure continues to be
closely monitored and reviewed against all international sanctions, with strict credit restrictions placed
on new business.
*Not within the scope of Deloitte LLP’s review report