RBS 2014 Annual Report Download - page 188
Download and view the complete annual report
Please find page 188 of the 2014 RBS annual report below. You can navigate through the pages in the report by either clicking on the pages listed below, or by using the keyword search tool below to find specific information within the annual report.-
 1
1 -
2
-
3
-
4
-
5
-
6
-
7
-
8
-
9
-
10
-
11
-
12
-
13
-
14
-
15
-
16
-
17
-
18
-
19
-
20
-
21
-
22
-
23
-
24
-
25
-
26
-
27
-
28
-
29
-
30
-
31
-
32
-
33
-
34
-
35
-
36
-
37
-
38
-
39
-
40
-
41
-
42
-
43
-
44
-
45
-
46
-
47
-
48
-
49
-
50
-
51
-
52
-
53
-
54
-
55
-
56
-
57
-
58
-
59
-
60
-
61
-
62
-
63
-
64
-
65
-
66
-
67
-
68
-
69
-
70
-
71
-
72
-
73
-
74
-
75
-
76
-
77
-
78
-
79
-
80
-
81
-
82
-
83
-
84
-
85
-
86
-
87
-
88
-
89
-
90
-
91
-
92
-
93
-
94
-
95
-
96
-
97
-
98
-
99
-
100
-
101
-
102
-
103
-
104
-
105
-
106
-
107
-
108
-
109
-
110
-
111
-
112
-
113
-
114
-
115
-
116
-
117
-
118
-
119
-
120
-
121
-
122
-
123
-
124
-
125
-
126
-
127
-
128
-
129
-
130
-
131
-
132
-
133
-
134
-
135
-
136
-
137
-
138
-
139
-
140
-
141
-
142
-
143
-
144
-
145
-
146
-
147
-
148
-
149
-
150
-
151
-
152
-
153
-
154
-
155
-
156
-
157
-
158
-
159
-
160
-
161
-
162
-
163
-
164
-
165
-
166
-
167
-
168
-
169
-
170
-
171
-
172
-
173
-
174
-
175
-
176
-
177
-
 178
178 -
 179
179 -
 180
180 -
 181
181 -
 182
182 -
 183
183 -
 184
184 -
 185
185 -
 186
186 -
 187
187 -
 188
188 -
 189
189 -
 190
190 -
 191
191 -
 192
192 -
 193
193 -
 194
194 -
 195
195 -
 196
196 -
 197
197 -
 198
198 -
199
 |
 |

1
RBS – Interim Results 2015
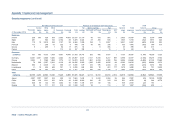
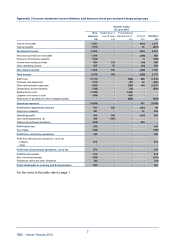
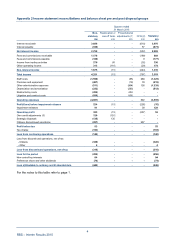
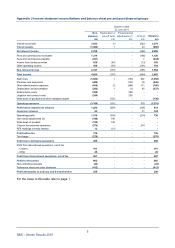
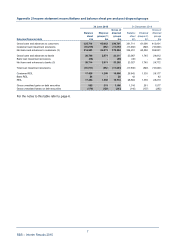
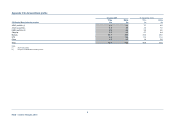
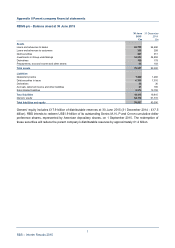
Appendix 3 Go-forward Bank profile
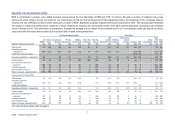
RBS is committed to a leaner, less volatile business based around its core franchises of PBB and CPB. To achieve this goal a number of initiatives have been
announced which include, but are not limited to, the restructuring of CIB into CIB Go-forward and CIB Capital Resolution, the divestment of the remaining stake in
Citizens, the exit of Williams & Glyn and the continued run down of RCR. Significant progress towards these exits is expected in 2015. The following table illustrates
the impact on certain key performance measures of these initiatives by showing the ‘Go-forward’ profile of the bank and the segments, businesses and portfolios
which it intends to exit. This information is presented to illustrate the strategy and its impact on the business and is on a non-statutory basis and should be read in
conjunction with the notes below as well as the section titled Forward-looking statements.
Go-forward Bank profile Exit Bank
CIB International Total
UK Ulste
r
Commercial Private CIB Go- Other Go- Total Go- Capital Williams private Othe
r
Exit Total
PBB (1) Bank Banking Banking (2) forward (3) forward (4) forward Resolution (3) & Glyn (5) banking Citizens RC
R
investments Bank RBS
Quarter ended 30 June 2015 £bn £bn £bn £bn £bn £bn £bn £bn £bn £bn £bn £bn £bn £bn £bn
Total income 1.3 0.2 0.9 0.2 0.4 0.1 3.1 0.1 0.2 0.1 0.8 0.1 - 1.3 4.4
Operating expenses
- adjusted (6) (0.7) (0.2) (0.4) (0.1) (0.4) 0.1 (1.7) (0.3) (0.1) - (0.5) (0.1) - (1.0) (2.7)
Impairment (losses)/releases - - - -- - - - -- (0.1) 0.2 - 0.1 0.1
Operating profit/(loss) - adjusted (6) 0.6 - 0.5 0.1 - 0.2 1.4 (0.2) 0.1 0.1 0.2 0.2 - 0.4 1.8
Funded assets 116 26 95 12 149 105 503 62 20 5 83 81 179 682
Net loans and advances to
customers 109 20 90 11 27 2 259 31 20 3 61 6- 121 380
Customer deposits 128 19 97 23 22 2 291 27 23 7 64 1- 122 413
Risk-weighted assets (7) 31 21 67 843 8 178 45 11 2 70 14 6 148 326
Return on equity - adjusted (6,8,9) 36% 11% 14% 5% nm nm 16% nm nm 9% 7% nm 10% 5% 11%
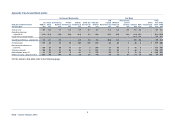
Quarter ended 31 March 2015
Total income 1.2 0.2 0.8 0.1 0.6 - 2.9 0.3 0.2 - 0.8 0.1 - 1.4 4.3
Operating expenses
- adjusted (6) (0.6) (0.1) (0.4) (0.2) (0.4) - (1.7) (0.4) (0.1) (0.1) (0.5) -- (1.1) (2.8)
Impairment releases - - - -- - - - -- - 0.1 - 0.1 0.1
Operating profit/(loss) - adjusted (6) 0.6 0.1 0.4 (0.1) 0.2 - 1.2 (0.1) 0.1 (0.1) 0.3 0.2 - 0.4 1.6
Funded assets 115 27 93 12 162 94 503 86 20 6 87 11 1 211 714
Net loans and advances to
customers 107 21 89 11 36 1 265 41 20 3 63 8- 135 400
Customer deposits 126 19 99 22 24 2 292 34 22 8 66 1- 131 423
Risk-weighted assets 32 22 66 845 9 182 58 11 2 72 17 7 167 349
Return on equity - adjusted (6,8,9) 35% 6% 12% 4% nm nm 12% nm nm 8% 7% nm 10% 7% 10%
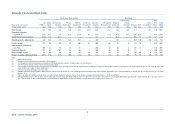
For notes to these tables refer to page 3.