RBS 2014 Annual Report Download - page 72
Download and view the complete annual report
Please find page 72 of the 2014 RBS annual report below. You can navigate through the pages in the report by either clicking on the pages listed below, or by using the keyword search tool below to find specific information within the annual report.-
 1
1 -
2
-
3
-
4
-
5
-
6
-
7
-
8
-
9
-
10
-
11
-
12
-
13
-
14
-
15
-
16
-
17
-
18
-
19
-
20
-
21
-
22
-
23
-
24
-
25
-
26
-
27
-
28
-
29
-
30
-
31
-
32
-
33
-
34
-
35
-
36
-
37
-
38
-
39
-
40
-
41
-
42
-
43
-
44
-
45
-
46
-
47
-
48
-
49
-
50
-
51
-
52
-
53
-
54
-
55
-
56
-
57
-
58
-
59
-
60
-
61
-
 62
62 -
 63
63 -
 64
64 -
 65
65 -
 66
66 -
 67
67 -
 68
68 -
 69
69 -
 70
70 -
 71
71 -
 72
72 -
 73
73 -
 74
74 -
 75
75 -
 76
76 -
 77
77 -
 78
78 -
 79
79 -
 80
80 -
 81
81 -
 82
82 -
83
-
84
-
85
-
86
-
87
-
88
-
89
-
90
-
91
-
92
-
93
-
94
-
95
-
96
-
97
-
98
-
99
-
100
-
101
-
102
-
103
-
104
-
105
-
106
-
107
-
108
-
109
-
110
-
111
-
112
-
113
-
114
-
115
-
116
-
117
-
118
-
119
-
120
-
121
-
122
-
123
-
124
-
125
-
126
-
127
-
128
-
129
-
130
-
131
-
132
-
133
-
134
-
135
-
136
-
137
-
138
-
139
-
140
-
141
-
142
-
143
-
144
-
145
-
146
-
147
-
148
-
149
-
150
-
151
-
152
-
153
-
154
-
155
-
156
-
157
-
158
-
159
-
160
-
161
-
162
-
163
-
164
-
165
-
166
-
167
-
168
-
169
-
170
-
171
-
172
-
173
-
174
-
175
-
176
-
177
-
178
-
179
-
180
-
181
-
182
-
183
-
184
-
185
-
186
-
187
-
188
-
189
-
190
-
191
-
192
-
193
-
194
-
195
-
196
-
197
-
198
-
199
 |
 |

70
RBS – Interim Results 2015
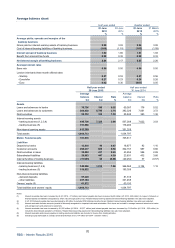
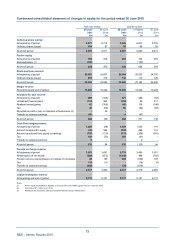
Average balance sheet
Half year ended Quarter ended
30 June 30 June 30 June 31 March
2015 2014 2015 2015
%% %%
Average yields, spreads and margins of the
banking business
Gross yield on interest-earning assets of banking business 2.98 3.03 2.94 3.02
Cost of interest-bearing liabilities of banking business (1.06) (1.18) (1.03) (1.09)
Interest spread of banking business 1.92 1.85 1.91 1.93
Benefit from interest-free funds 0.32 0.32 0.32 0.33
Net interest margin of banking business 2.24 2.17 2.23 2.26
Average interest rates
Base rate 0.50 0.50 0.50 0.50
London inter-bank three month offered rates
- Sterling 0.57 0.53 0.57 0.56
- Eurodollar 0.27 0.23 0.28 0.26
- Euro 0.02 0.30 (0.01) 0.05
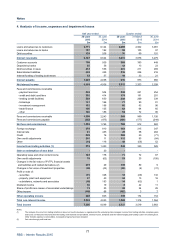
Half year ended Half year ended
30 June 2015 30 June 2014
Average Average
balance Interest Rate balance Interest Rate
£m £m %£m £m %
Assets
Loans and advances to banks 76,736 199 0.52 69,097 178 0.52
Loans and advances to customers 366,858 6,795 3.74 382,326 7,061 3.72
Debt securities 52,132 335 1.30 55,845 383 1.38
Interest-earning assets
- banking business (1,2,3,4) 495,726 7,329 2.98 507,268 7,622 3.03
- trading business (5) 151,588 176,200
Non-interest earning assets 413,399 351,329
Total assets 1,060,713 1,034,797
Memo: Funded assets 701,616 745,611
Liabilities
Deposits by banks 13,818 46 0.67 16,877 92 1.10
Customer accounts 290,317 839 0.58 302,157 987 0.66
Debt securities in issue 35,463 431 2.45 43,954 586 2.69
Subordinated liabilities 20,963 447 4.30 23,831 432 3.66
Internal funding of trading business (15,505) 52 (0.68) (20,254) 57 (0.57)
Interest-bearing liabilities
- banking business (1,2,4) 345,056 1,815 1.06 366,565 2,154 1.18
- trading business (5) 159,632 185,308
Non-interest-bearing liabilities
- demand deposits 97,349 81,316
- other liabilities 397,104 341,458
Owners’ equity (6) 61,572 60,150
Total liabilities and owners’ equity 1,060,713 1,034,797
Notes:
(1) Interest receivable has been increased by nil (H1 2014 - £1 million) and interest payable has been increased by £8 million (H1 2014 - £29 million) in respect of interest on
financial assets and liabilities designated as at fair value through profit or loss. Related interest-earning assets and interest-bearing liabilities have also been adjusted.
(2) In H1 2014 interest payable has been decreased by £3 million to exclude RFS Holdings minority interest. Related interest-bearing liabilities have also been adjusted.
(3) Interest receivable includes amounts (unwind of discount) recognised on impaired loans and receivables. Such loans are included in average loans and advances to banks
and average loans and advances to customers.
(4) Interest receivable has been increased by £1,222 million (H1 2014 - £1,077 million) and interest payable has been increased by £118 million (H1 2014 - £90 million) to
include the discontinued operations of Citizens. Related interest-earning assets and interest-bearing liabilities have also been adjusted.
(5) Interest receivable and interest payable on trading assets and liabilities are included in income from trading activities.
(6) Including equity attributable to ordinary and B shareholders of £51,174 million (H1 2014 - £53,931 million).