RBS 2014 Annual Report Download - page 16
Download and view the complete annual report
Please find page 16 of the 2014 RBS annual report below. You can navigate through the pages in the report by either clicking on the pages listed below, or by using the keyword search tool below to find specific information within the annual report.-
 1
1 -
2
-
3
-
4
-
5
-
 6
6 -
 7
7 -
 8
8 -
 9
9 -
 10
10 -
 11
11 -
 12
12 -
 13
13 -
 14
14 -
 15
15 -
 16
16 -
 17
17 -
 18
18 -
 19
19 -
 20
20 -
 21
21 -
 22
22 -
 23
23 -
 24
24 -
 25
25 -
 26
26 -
27
-
28
-
29
-
30
-
31
-
32
-
33
-
34
-
35
-
36
-
37
-
38
-
39
-
40
-
41
-
42
-
43
-
44
-
45
-
46
-
47
-
48
-
49
-
50
-
51
-
52
-
53
-
54
-
55
-
56
-
57
-
58
-
59
-
60
-
61
-
62
-
63
-
64
-
65
-
66
-
67
-
68
-
69
-
70
-
71
-
72
-
73
-
74
-
75
-
76
-
77
-
78
-
79
-
80
-
81
-
82
-
83
-
84
-
85
-
86
-
87
-
88
-
89
-
90
-
91
-
92
-
93
-
94
-
95
-
96
-
97
-
98
-
99
-
100
-
101
-
102
-
103
-
104
-
105
-
106
-
107
-
108
-
109
-
110
-
111
-
112
-
113
-
114
-
115
-
116
-
117
-
118
-
119
-
120
-
121
-
122
-
123
-
124
-
125
-
126
-
127
-
128
-
129
-
130
-
131
-
132
-
133
-
134
-
135
-
136
-
137
-
138
-
139
-
140
-
141
-
142
-
143
-
144
-
145
-
146
-
147
-
148
-
149
-
150
-
151
-
152
-
153
-
154
-
155
-
156
-
157
-
158
-
159
-
160
-
161
-
162
-
163
-
164
-
165
-
166
-
167
-
168
-
169
-
170
-
171
-
172
-
173
-
174
-
175
-
176
-
177
-
178
-
179
-
180
-
181
-
182
-
183
-
184
-
185
-
186
-
187
-
188
-
189
-
190
-
191
-
192
-
193
-
194
-
195
-
196
-
197
-
198
-
199
 |
 |
14
RBS – Interim Results 2015
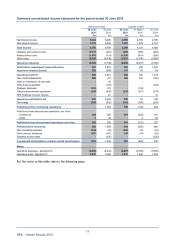
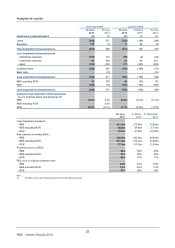
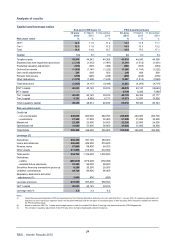
Summary consolidated balance sheet as at 30 June 2015
30 June 31 March 31 December
Balance sheet related key metrics and ratios 2015 2015 2014
Tangible net asset value per ordinary and equivalent B share (1) 380p 384p 387p
Loan:deposit ratio (2,3) 92% 95% 95%
Short-term wholesale funding (2,4) £25bn £27bn £28bn
Wholesale funding (2,4) £76bn £84bn £90bn
Liquidity portfolio £161bn £157bn £151bn
Liquidity coverage ratio (5) 117% 112% 112%
Net stable funding ratio (6) 115% 110% 112%
Common Equity Tier 1 ratio 12.3% 11.5% 11.2%
Risk-weighted assets £326.4bn £348.6bn £355.9bn
Leverage ratio (7) 4.6% 4.3% 4.2%
Tangible equity (8) £43,919m £44,242m £44,368m
Number of ordinary shares and equivalent B shares in issue (millions) (9) 11,570 11,514 11,466
30 June
Key metrics and ratios - excluding Citizens (10) 2015
Tangible net asset value per ordinary and equivalent B share (1) 380p
Loan:deposit ratio (2,3) 91%
Short-term wholesale funding (2,4) £21bn
Wholesale funding (2,4) £71bn
Liquidity portfolio £148bn
Liquidity coverage ratio (5) 118%
Net stable funding ratio (6) 112%
Common Equity Tier 1 ratio 15.3%
Risk-weighted assets £261.5bn
Leverage ratio (7) 5.1%
Tangible equity (8) £43,919m
Return on tangible equity (8) (1.0%)
A
verage tangible equity (8) £43,524m
Notes:
(1) Tangible net asset value per ordinary and equivalent B share represents total tangible equity divided by the number of ordinary and equivalent B shares in issue.
(2) Includes disposal groups.
(3) Excludes repurchase agreements and stock lending.
(4) Excludes derivative collateral.
(5) In January 2013, the BCBS published its final guidance for calculating LCR currently expected to come into effect from October 2015 on a phased basis. Pending the
finalisation of the LCR rules within the EU, RBS monitors LCR based on its interpretation of current guidance available for EU LCR reporting. The reported LCR will
change over time with regulatory developments. Due to differences in interpretation, RBS’s ratio may not be comparable with those of other financial institutions.
(6) NSFR for both periods has been calculated using RBS’s current interpretations of the revised BCBS guidance on NSFR issued in late 2014. Therefore, reported NSFR will
change over time with regulatory developments. Due to differences in interpretation, RBS’s ratio may not be comparable with those of other financial institutions.
(7) Based on end-point CRR Tier 1 capital and revised 2014 Basel III leverage ratio framework.
(8) Tangible equity is equity attributable to ordinary and B shareholders less intangible assets.
(9) Includes 26 million Treasury shares (31 March 2015 - 27 million; 31 December 2014 - 28 million).
(10) Assuming Citizens was fully divested of at carrying value on 30 June 2015 and excluding only credit risk and counterparty risk RWA.