RBS 2014 Annual Report Download - page 34
Download and view the complete annual report
Please find page 34 of the 2014 RBS annual report below. You can navigate through the pages in the report by either clicking on the pages listed below, or by using the keyword search tool below to find specific information within the annual report.-
 1
1 -
2
-
3
-
4
-
5
-
6
-
7
-
8
-
9
-
10
-
11
-
12
-
13
-
14
-
15
-
16
-
17
-
18
-
19
-
20
-
21
-
22
-
23
-
 24
24 -
 25
25 -
 26
26 -
 27
27 -
 28
28 -
 29
29 -
 30
30 -
 31
31 -
 32
32 -
 33
33 -
 34
34 -
 35
35 -
 36
36 -
 37
37 -
 38
38 -
 39
39 -
 40
40 -
 41
41 -
 42
42 -
 43
43 -
 44
44 -
45
-
46
-
47
-
48
-
49
-
50
-
51
-
52
-
53
-
54
-
55
-
56
-
57
-
58
-
59
-
60
-
61
-
62
-
63
-
64
-
65
-
66
-
67
-
68
-
69
-
70
-
71
-
72
-
73
-
74
-
75
-
76
-
77
-
78
-
79
-
80
-
81
-
82
-
83
-
84
-
85
-
86
-
87
-
88
-
89
-
90
-
91
-
92
-
93
-
94
-
95
-
96
-
97
-
98
-
99
-
100
-
101
-
102
-
103
-
104
-
105
-
106
-
107
-
108
-
109
-
110
-
111
-
112
-
113
-
114
-
115
-
116
-
117
-
118
-
119
-
120
-
121
-
122
-
123
-
124
-
125
-
126
-
127
-
128
-
129
-
130
-
131
-
132
-
133
-
134
-
135
-
136
-
137
-
138
-
139
-
140
-
141
-
142
-
143
-
144
-
145
-
146
-
147
-
148
-
149
-
150
-
151
-
152
-
153
-
154
-
155
-
156
-
157
-
158
-
159
-
160
-
161
-
162
-
163
-
164
-
165
-
166
-
167
-
168
-
169
-
170
-
171
-
172
-
173
-
174
-
175
-
176
-
177
-
178
-
179
-
180
-
181
-
182
-
183
-
184
-
185
-
186
-
187
-
188
-
189
-
190
-
191
-
192
-
193
-
194
-
195
-
196
-
197
-
198
-
199
 |
 |
32
RBS – Interim Results 2015
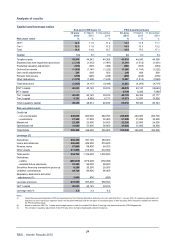
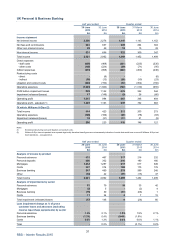
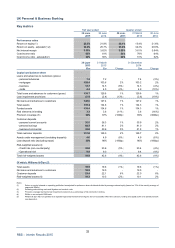
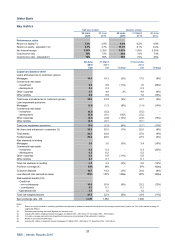
UK Personal & Business Banking
Key metrics
Half year ended Quarter ended
30 June 30 June 30 June 31 March 30 June
2015 2014 2015 2015 2014
Performance ratios
Return on equity (1) 23.6% 21.8% 32.1% 15.4% 21.6%
Return on equity - adjusted (1,2) 34.0% 25.7% 33.6% 34.3% 29.9%
Net interest margin 3.59% 3.62% 3.58% 3.61% 3.64%
Cost:income ratio 66% 61% 54% 78% 64%
Cost:income ratio - adjusted (2) 52% 56% 52% 51% 52%
30 June 31 March 31 Decembe
r
2015 2015 2014
£bn £bn Change £bn Change
Capital and balance sheet
Loans and advances to customers (gross)
- personal advances 7.2 7.2 -7.4 (3%)
- mortgages 105.4 103.6 2% 103.2 2%
- business 13.7 14.5 (6%) 14.3 (4%)
- cards 4.4 4.5 (2%) 4.9 (10%)
Total loans and advances to customers (gross) 130.7 129.8 1% 129.8 1%
Loan impairment provisions (2.1) (2.4) (13%) (2.6) (19%)
Net loans and advances to customers 128.6 127.4 1% 127.2 1%
Total assets 135.4 134.6 1% 134.3 1%
Funded assets 135.4 134.6 1% 134.3 1%
Risk elements in lending 3.2 3.6 (11%) 3.8 (16%)
Provision coverage (3) 66% 67% (100bp) 69% (300bp)
Customer deposits
- personal current accounts 36.5 36.3 1% 35.9 2%
- personal savings 82.5 81.1 2% 81.0 2%
- business/commercial 32.0 30.6 5% 31.8 1%
Total customer deposits 151.0 148.0 2% 148.7 2%
A
ssets under management (excluding deposits) 4.6 4.9 (6%) 4.9 (6%)
Loan:deposit ratio (excluding repos) 85% 86% (100bp) 86% (100bp)
Risk-weighted assets (4)
- Credit risk (non-counterparty) 32.0 33.6 (5%) 33.4 (4%)
- Operational risk 9.0 9.0 -9.4 (4%)
Total risk-weighted assets 41.0 42.6 (4%) 42.8 (4%)
Of which: Williams & Glyn (5)
Total assets 19.5 19.6 (1%) 19.6 (1%)
Net loans and advances to customers 19.5 19.5 - 19.5 -
Customer deposits 23.4 22.1 6% 22.0 6%
Risk-weighted assets (4) 10.3 10.5 (2%) 10.1 2%
Notes:
(1) Return on equity is based on operating profit after tax adjusted for preference share dividends divided by average notional equity (based on 13% of the monthly average o
f
segmental RWAe).
(2) Excluding restructuring costs and litigation and conduct costs.
(3) Provision coverage represents loan impairment provisions as a percentage of risk elements in lending.
(4) RWAs on an end-point CRR basis.
(5) Williams & Glyn has not operated as a separate legal entity therefore these figures do not necessarily reflect the cost base, funding and capital profile of a standalone ban
k
see Appendix 4.