RBS 2014 Annual Report Download - page 19
Download and view the complete annual report
Please find page 19 of the 2014 RBS annual report below. You can navigate through the pages in the report by either clicking on the pages listed below, or by using the keyword search tool below to find specific information within the annual report.-
 1
1 -
2
-
3
-
4
-
5
-
6
-
7
-
8
-
 9
9 -
 10
10 -
 11
11 -
 12
12 -
 13
13 -
 14
14 -
 15
15 -
 16
16 -
 17
17 -
 18
18 -
 19
19 -
 20
20 -
 21
21 -
 22
22 -
 23
23 -
 24
24 -
 25
25 -
 26
26 -
 27
27 -
 28
28 -
 29
29 -
30
-
31
-
32
-
33
-
34
-
35
-
36
-
37
-
38
-
39
-
40
-
41
-
42
-
43
-
44
-
45
-
46
-
47
-
48
-
49
-
50
-
51
-
52
-
53
-
54
-
55
-
56
-
57
-
58
-
59
-
60
-
61
-
62
-
63
-
64
-
65
-
66
-
67
-
68
-
69
-
70
-
71
-
72
-
73
-
74
-
75
-
76
-
77
-
78
-
79
-
80
-
81
-
82
-
83
-
84
-
85
-
86
-
87
-
88
-
89
-
90
-
91
-
92
-
93
-
94
-
95
-
96
-
97
-
98
-
99
-
100
-
101
-
102
-
103
-
104
-
105
-
106
-
107
-
108
-
109
-
110
-
111
-
112
-
113
-
114
-
115
-
116
-
117
-
118
-
119
-
120
-
121
-
122
-
123
-
124
-
125
-
126
-
127
-
128
-
129
-
130
-
131
-
132
-
133
-
134
-
135
-
136
-
137
-
138
-
139
-
140
-
141
-
142
-
143
-
144
-
145
-
146
-
147
-
148
-
149
-
150
-
151
-
152
-
153
-
154
-
155
-
156
-
157
-
158
-
159
-
160
-
161
-
162
-
163
-
164
-
165
-
166
-
167
-
168
-
169
-
170
-
171
-
172
-
173
-
174
-
175
-
176
-
177
-
178
-
179
-
180
-
181
-
182
-
183
-
184
-
185
-
186
-
187
-
188
-
189
-
190
-
191
-
192
-
193
-
194
-
195
-
196
-
197
-
198
-
199
 |
 |
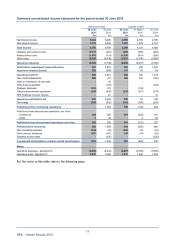
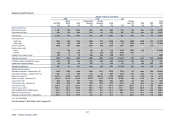
17
RBS – Interim Results 2015
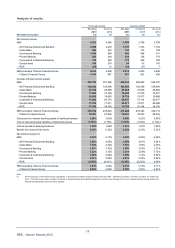
Analysis of results
Half year ended Quarter ended
30 June 30 June 30 June 31 March 30 June
2015 2014 2015 2015 2014
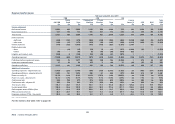
Net interest income £m £m £m £m £m
Net interest income
RBS 5,522 5,496 2,766 2,756 2,798
- UK Personal & Business Banking 2,290 2,276 1,147 1,143 1,152
- Ulster Bank 265 323 132 133 169
- Commercial Banking 1,108 999 562 546 511
- Private Banking 254 344 126 128 174
- Corporate & Institutional Banking 376 365 174 202 186
- Central items 150 203 88 62 100
- RCR (25) (1) (14) (11) 7
RBS excluding Citizens Financial Group 4,418 4,509 2,215 2,203 2,299
- Citizens Financial Group 1,104 987 551 553 499
A
verage interest-earning assets
RBS 495,726 507,268 496,835 494,605 502,347
- UK Personal & Business Banking 128,468 126,696 128,569 128,366 126,964
- Ulster Bank 27,518 28,089 27,404 27,633 28,884
- Commercial Banking 77,985 74,749 78,880 77,079 74,971
- Private Banking 15,850 18,663 15,729 15,973 18,698
- Corporate & Institutional Banking 71,269 83,778 69,437 73,114 83,477
- Central items 77,793 71,071 82,471 73,071 66,586
- RCR 17,436 36,383 14,758 20,144 34,533
RBS excluding Citizens Financial Group 416,319 439,429 417,248 415,380 434,113
- Citizens Financial Group 79,407 67,839 79,587 79,225 68,234
Gross yield on interest-earning assets of banking business 2.98% 3.03% 2.94% 3.02% 3.05%
Cost of interest-bearing liabilities of banking business (1.06%) (1.18%) (1.03%) (1.09%) (1.16%)
Interest spread of banking business 1.92% 1.85% 1.91% 1.93% 1.89%
Benefit from interest free funds 0.32% 0.32% 0.32% 0.33% 0.33%
Net interest margin (1)
RBS 2.24% 2.17% 2.23% 2.26% 2.22%
- UK Personal & Business Banking 3.59% 3.62% 3.58% 3.61% 3.64%
- Ulster Bank 1.94% 2.32% 1.93% 1.95% 2.35%
- Commercial Banking 2.87% 2.70% 2.86% 2.87% 2.73%
- Private Banking 3.23% 3.72% 3.21% 3.25% 3.73%
- Corporate & Institutional Banking 1.06% 0.88% 1.00% 1.12% 0.90%
- Central items 0.37% 0.50% 0.41% 0.32% 0.52%
- RCR (0.29%) (0.01%) (0.38%) (0.22%) 0.08%
RBS excluding Citizens Financial Group 2.14% 2.06% 2.13% 2.15% 2.11%
- Citizens Financial Group 2.80% 2.94% 2.78% 2.83% 2.93%
Note:
(1) For the purposes of net interest margin calculations, a decrease of £8 million arising in Central Items (H1 2014 - £28 million; Q2 2015 - £3 million; Q1 2015 - £5 million; Q2
2014 - £14 million) was made in respect of interest on financial assets and liabilities designated as at fair value through profit or loss. Related interest-earning assets and
interest-bearing liabilities have also been adjusted.