RBS 2014 Annual Report Download - page 75
Download and view the complete annual report
Please find page 75 of the 2014 RBS annual report below. You can navigate through the pages in the report by either clicking on the pages listed below, or by using the keyword search tool below to find specific information within the annual report.-
 1
1 -
2
-
3
-
4
-
5
-
6
-
7
-
8
-
9
-
10
-
11
-
12
-
13
-
14
-
15
-
16
-
17
-
18
-
19
-
20
-
21
-
22
-
23
-
24
-
25
-
26
-
27
-
28
-
29
-
30
-
31
-
32
-
33
-
34
-
35
-
36
-
37
-
38
-
39
-
40
-
41
-
42
-
43
-
44
-
45
-
46
-
47
-
48
-
49
-
50
-
51
-
52
-
53
-
54
-
55
-
56
-
57
-
58
-
59
-
60
-
61
-
62
-
63
-
64
-
 65
65 -
 66
66 -
 67
67 -
 68
68 -
 69
69 -
 70
70 -
 71
71 -
 72
72 -
 73
73 -
 74
74 -
 75
75 -
 76
76 -
 77
77 -
 78
78 -
 79
79 -
 80
80 -
 81
81 -
 82
82 -
 83
83 -
 84
84 -
 85
85 -
86
-
87
-
88
-
89
-
90
-
91
-
92
-
93
-
94
-
95
-
96
-
97
-
98
-
99
-
100
-
101
-
102
-
103
-
104
-
105
-
106
-
107
-
108
-
109
-
110
-
111
-
112
-
113
-
114
-
115
-
116
-
117
-
118
-
119
-
120
-
121
-
122
-
123
-
124
-
125
-
126
-
127
-
128
-
129
-
130
-
131
-
132
-
133
-
134
-
135
-
136
-
137
-
138
-
139
-
140
-
141
-
142
-
143
-
144
-
145
-
146
-
147
-
148
-
149
-
150
-
151
-
152
-
153
-
154
-
155
-
156
-
157
-
158
-
159
-
160
-
161
-
162
-
163
-
164
-
165
-
166
-
167
-
168
-
169
-
170
-
171
-
172
-
173
-
174
-
175
-
176
-
177
-
178
-
179
-
180
-
181
-
182
-
183
-
184
-
185
-
186
-
187
-
188
-
189
-
190
-
191
-
192
-
193
-
194
-
195
-
196
-
197
-
198
-
199
 |
 |

73
RBS – Interim Results 2015
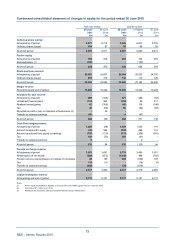
Condensed consolidated statement of changes in equity for the period ended 30 June 2015
Half year ended Quarter ended
30 June 30 June 30 June 31 March 30 June
2015 2014 2015 2015 2014
£m £m £m £m £m
Retained earnings
A
t beginning of period (2,518) 867 (2,416) (2,518) 1,986
(Loss)/profit attributable to ordinary and
B shareholders and other equity owners
- continuing operations (50) 1,610 111 (161) 446
- discontinued operations 64 302 275 (211) 196
Equity preference dividends paid (143) (140) (73) (70) (75)
Paid-in equity dividends paid, net of tax (24) (27) (20) (4) (17)
Dividend access share dividend - (320) - - (320)
Transfer from available-for-sale reserve 43 - (4) 47 -
Transfer from cash flow hedging reserve (9) - - (9) -
Transfer from foreign exchange reserve 642 - 24 618 -
Costs of placing Citizens Financial Group equity (29) - - (29) -
Shares issued under employee share schemes (57) (41) (1) (56) (5)
Share-based payments
- gross 10 8 6 4 47
- tax - (1) - - -
Reclassification of paid-in equity (27) - - (27) -
A
t end of period (2,098) 2,258 (2,098) (2,416) 2,258
Own shares held
A
t beginning of period (113) (137) (111) (113) (136)
Disposal of own shares 5 1 3 2 -
A
t end of period (108) (136) (108) (111) (136)
Owners’ equity at end of period 56,064 60,345 56,064 56,808 60,345
Non-controlling interests
A
t beginning of period 2,946 473 5,473 2,946 612
Currency translation adjustments and other movements (63) (16) (146) 83 (19)
Profit/(loss) attributable to non-controlling interests
- continuing operations 50 24 29 21 12
- discontinued operations 294 18 399 (105) 11
Dividends paid (31) - (20) (11) -
Movements in available-for-sale securities
- unrealised gains/(losses) 12 (2) (45) 57 (1)
- realised (gains)/losses (6) 6 (6) - 3
- tax (5) - 16 (21) -
Movements in cash flow hedging reserve
- amount recognised in equity 21 - 9 12 -
- tax (4) - (4) - -
Equity raised (3) 2,491 115 - 2,491 -
At end of period 5,705 618 5,705 5,473 618
Total equity at end of period 61,769 60,963 61,769 62,281 60,963
Total equity is attributable to:
Non-controlling interests 5,705 618 5,705 5,473 618
Preference shareholders 4,313 4,313 4,313 4,313 4,313
Paid-in equity holders 634 979 634 634 979
Ordinary and B shareholders 51,117 55,053 51,117 51,861 55,053
61,769 60,963 61,769 62,281 60,963
For the notes to this table refer to page 72.