RBS 2014 Annual Report Download - page 37
Download and view the complete annual report
Please find page 37 of the 2014 RBS annual report below. You can navigate through the pages in the report by either clicking on the pages listed below, or by using the keyword search tool below to find specific information within the annual report.-
 1
1 -
2
-
3
-
4
-
5
-
6
-
7
-
8
-
9
-
10
-
11
-
12
-
13
-
14
-
15
-
16
-
17
-
18
-
19
-
20
-
21
-
22
-
23
-
24
-
25
-
26
-
 27
27 -
 28
28 -
 29
29 -
 30
30 -
 31
31 -
 32
32 -
 33
33 -
 34
34 -
 35
35 -
 36
36 -
 37
37 -
 38
38 -
 39
39 -
 40
40 -
 41
41 -
 42
42 -
 43
43 -
 44
44 -
 45
45 -
 46
46 -
 47
47 -
48
-
49
-
50
-
51
-
52
-
53
-
54
-
55
-
56
-
57
-
58
-
59
-
60
-
61
-
62
-
63
-
64
-
65
-
66
-
67
-
68
-
69
-
70
-
71
-
72
-
73
-
74
-
75
-
76
-
77
-
78
-
79
-
80
-
81
-
82
-
83
-
84
-
85
-
86
-
87
-
88
-
89
-
90
-
91
-
92
-
93
-
94
-
95
-
96
-
97
-
98
-
99
-
100
-
101
-
102
-
103
-
104
-
105
-
106
-
107
-
108
-
109
-
110
-
111
-
112
-
113
-
114
-
115
-
116
-
117
-
118
-
119
-
120
-
121
-
122
-
123
-
124
-
125
-
126
-
127
-
128
-
129
-
130
-
131
-
132
-
133
-
134
-
135
-
136
-
137
-
138
-
139
-
140
-
141
-
142
-
143
-
144
-
145
-
146
-
147
-
148
-
149
-
150
-
151
-
152
-
153
-
154
-
155
-
156
-
157
-
158
-
159
-
160
-
161
-
162
-
163
-
164
-
165
-
166
-
167
-
168
-
169
-
170
-
171
-
172
-
173
-
174
-
175
-
176
-
177
-
178
-
179
-
180
-
181
-
182
-
183
-
184
-
185
-
186
-
187
-
188
-
189
-
190
-
191
-
192
-
193
-
194
-
195
-
196
-
197
-
198
-
199
 |
 |

35
RBS – Interim Results 2015
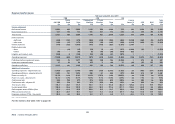
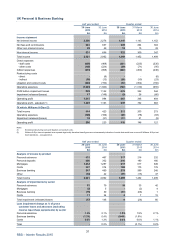
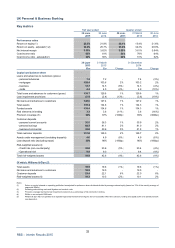
UK Personal & Business Banking
Key points (continued)
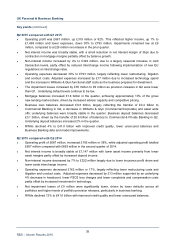
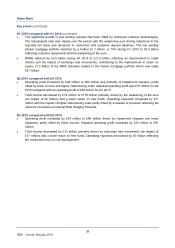
Q2 2015 compared with Q1 2015
• Operating profit was £667 million, up £319 million or 92%. This reflected higher income, up 1% to
£1,469 million and lower expenses, down 30% to £793 million. Impairments remained low at £9
million, compared to a £26 million net release in the prior quarter.
• Net interest income was broadly stable, with a small reduction in net interest margin of 3bps due to
contraction in mortgage margins partially offset by balance growth.
• Non-interest income increased by 4% to £322 million, due to a largely seasonal increase in card
transaction levels, partly offset by reduced interchange income following implementation of new EU
regulations on interchange rates.
• Operating expenses decreased 30% to £793 million, largely reflecting lower restructuring, litigation
and conduct costs. Adjusted expenses increased by £17 million due to increased technology spend
and the increase in Williams & Glyn functional staff costs as the business prepares for divestment.
• The impairment losses increased by £35 million to £9 million as provision releases in Q2 were lowe
r
than Q1. Underlying default levels continue to be low.
• Mortgage balances increased £1.8 billion in the quarter, achieving approximately 10% of the gross
new lending market share, driven by increased adviser capacity and competitive pricing.
• Business loan balances decreased £0.8 billion, largely reflecting the transfer of £0.4 billion to
Commercial Banking in Q2, a decrease in Williams & Glyn (Commercial/Corporate) and asset write
offs; underlying balances were broadly stable in the quarter. Business deposit balances decreased
£0.1 billion, driven by the transfer of £0.6 billion of balances to Commercial & Private Banking in Q2.
Underlying deposit balances increased 2% in the quarter.
• RWAs declined 4% to £41.0 billion with improved credit quality, lower unsecured balances and
Business Banking data and model improvements.
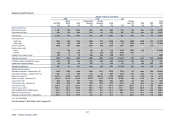
Q2 2015 compared with Q2 2014
• Operating profit of £667 million, increased £183 million or 38%, while adjusted operating profit totalled
£697 million compared with £663 million in the second quarter of 2014.
• Net interest income is broadly stable at £1,147 million with lower asset income primarily from lowe
r
asset margins partly offset by increased deposit income.
• Non-interest income decreased by 7% to £322 million largely due to lower insurance profit share and
lower cards interchange income.
• Operating expenses decreased £162 million or 17%, largely reflecting lower restructuring costs and
litigation and conduct costs. Adjusted expenses decreased by £13 million supported by an underlying
4% decrease in headcount, lower FSCS levy charges and lower complaints and compensation costs
partly offset by increased investment in technology.
• Net impairment losses of £9 million were significantly lower, driven by lower defaults across all
portfolios and higher levels of portfolio provision releases, particularly in business banking.
• RWAs declined 13% to £41.0 billion with improved credit quality and lower unsecured balances.