RBS 2014 Annual Report Download - page 68
Download and view the complete annual report
Please find page 68 of the 2014 RBS annual report below. You can navigate through the pages in the report by either clicking on the pages listed below, or by using the keyword search tool below to find specific information within the annual report.-
 1
1 -
2
-
3
-
4
-
5
-
6
-
7
-
8
-
9
-
10
-
11
-
12
-
13
-
14
-
15
-
16
-
17
-
18
-
19
-
20
-
21
-
22
-
23
-
24
-
25
-
26
-
27
-
28
-
29
-
30
-
31
-
32
-
33
-
34
-
35
-
36
-
37
-
38
-
39
-
40
-
41
-
42
-
43
-
44
-
45
-
46
-
47
-
48
-
49
-
50
-
51
-
52
-
53
-
54
-
55
-
56
-
57
-
 58
58 -
 59
59 -
 60
60 -
 61
61 -
 62
62 -
 63
63 -
 64
64 -
 65
65 -
 66
66 -
 67
67 -
 68
68 -
 69
69 -
 70
70 -
 71
71 -
 72
72 -
 73
73 -
 74
74 -
 75
75 -
 76
76 -
 77
77 -
 78
78 -
79
-
80
-
81
-
82
-
83
-
84
-
85
-
86
-
87
-
88
-
89
-
90
-
91
-
92
-
93
-
94
-
95
-
96
-
97
-
98
-
99
-
100
-
101
-
102
-
103
-
104
-
105
-
106
-
107
-
108
-
109
-
110
-
111
-
112
-
113
-
114
-
115
-
116
-
117
-
118
-
119
-
120
-
121
-
122
-
123
-
124
-
125
-
126
-
127
-
128
-
129
-
130
-
131
-
132
-
133
-
134
-
135
-
136
-
137
-
138
-
139
-
140
-
141
-
142
-
143
-
144
-
145
-
146
-
147
-
148
-
149
-
150
-
151
-
152
-
153
-
154
-
155
-
156
-
157
-
158
-
159
-
160
-
161
-
162
-
163
-
164
-
165
-
166
-
167
-
168
-
169
-
170
-
171
-
172
-
173
-
174
-
175
-
176
-
177
-
178
-
179
-
180
-
181
-
182
-
183
-
184
-
185
-
186
-
187
-
188
-
189
-
190
-
191
-
192
-
193
-
194
-
195
-
196
-
197
-
198
-
199
 |
 |

66
RBS – Interim Results 2015
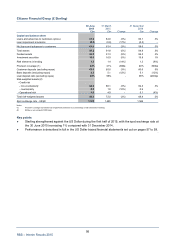
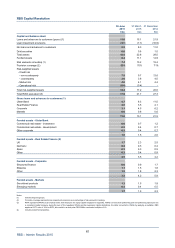
RBS Capital Resolution
Key points
● RCR funded assets have fallen by 78% since the initial pool of assets was identified. The commitment
is to reduce funded assets by 85% by the end of 2015, a year earlier than planned.
● RCR funded assets fell to £8 billion, a reduction of £7 billion, or 44%, since the beginning of the year.
The reduction was mainly achieved through disposals and repayments. Disposal activity continues
across the portfolio, with 342 deals completed during H1 2015 at an average price of 106% of book
value.
● Since the start of the year RWA equivalent has fallen by £9 billion to £18 billion reflecting the
combination of disposals and repayments offset by the impact of further impairment releases and
write-offs.
● Operating profit for H1 2015 was £357 million, driven by impairment releases of £293 million reflective
of an improvement in underlying collateral values, proactive debt management and favourable
economic conditions.
● The net effect of the operating profit of £357 million and RWA equivalent reduction of £9 billion (1) was
CET1 accretion of £1.3 billion.
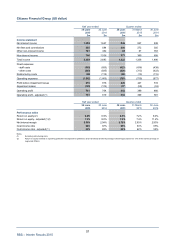
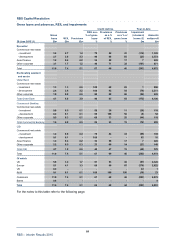
Q2 2015 compared with Q1 2015
• RCR funded assets have been reduced by £3 billion, or 24% to £8 billion from Q1 2015, driven by
disposals and repayments.
• RWA equivalent decreased by £4 billion, or 18%, since Q1 2015.
Q2 2015 compared with Q2 2014
• RCR funded assets have been reduced by £13 billion, or 60%, from Q2 2014.
• RWA equivalent decreased by £26 billion, or 59%, from Q2 2014. This primarily reflects our active
disposal and repayment programme.
Note:
(1) Capital equivalent: £0.9 billion at an internal CET1 ratio of 10%.