RBS 2014 Annual Report Download - page 5
Download and view the complete annual report
Please find page 5 of the 2014 RBS annual report below. You can navigate through the pages in the report by either clicking on the pages listed below, or by using the keyword search tool below to find specific information within the annual report.-
 1
1 -
 2
2 -
 3
3 -
 4
4 -
 5
5 -
 6
6 -
 7
7 -
 8
8 -
 9
9 -
 10
10 -
 11
11 -
 12
12 -
 13
13 -
 14
14 -
 15
15 -
 16
16 -
17
-
18
-
19
-
20
-
21
-
22
-
23
-
24
-
25
-
26
-
27
-
28
-
29
-
30
-
31
-
32
-
33
-
34
-
35
-
36
-
37
-
38
-
39
-
40
-
41
-
42
-
43
-
44
-
45
-
46
-
47
-
48
-
49
-
50
-
51
-
52
-
53
-
54
-
55
-
56
-
57
-
58
-
59
-
60
-
61
-
62
-
63
-
64
-
65
-
66
-
67
-
68
-
69
-
70
-
71
-
72
-
73
-
74
-
75
-
76
-
77
-
78
-
79
-
80
-
81
-
82
-
83
-
84
-
85
-
86
-
87
-
88
-
89
-
90
-
91
-
92
-
93
-
94
-
95
-
96
-
97
-
98
-
99
-
100
-
101
-
102
-
103
-
104
-
105
-
106
-
107
-
108
-
109
-
110
-
111
-
112
-
113
-
114
-
115
-
116
-
117
-
118
-
119
-
120
-
121
-
122
-
123
-
124
-
125
-
126
-
127
-
128
-
129
-
130
-
131
-
132
-
133
-
134
-
135
-
136
-
137
-
138
-
139
-
140
-
141
-
142
-
143
-
144
-
145
-
146
-
147
-
148
-
149
-
150
-
151
-
152
-
153
-
154
-
155
-
156
-
157
-
158
-
159
-
160
-
161
-
162
-
163
-
164
-
165
-
166
-
167
-
168
-
169
-
170
-
171
-
172
-
173
-
174
-
175
-
176
-
177
-
178
-
179
-
180
-
181
-
182
-
183
-
184
-
185
-
186
-
187
-
188
-
189
-
190
-
191
-
192
-
193
-
194
-
195
-
196
-
197
-
198
-
199
 |
 |

3
RBS – Interim Results 2015
Highlights
The Royal Bank of Scotland Group (RBS) continues to deliver on its plan to build a stronger, simpler
and fairer bank for both customers and shareholders.
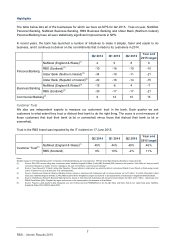
A strong operating performance from Personal & Business Banking (PBB) and Commercial & Private
Banking (CPB) contributed to an attributable profit of £293 million for Q2 2015 (loss of £153 million for H1
2015):
● Q2 operating profit(1) was £304 million, in line with Q1 2015. Litigation and conduct costs were lower at
£459 million compared with £856 million in Q1 2015, while restructuring costs rose to £1,050 million
from £453 million in Q1 2015 as the pace of restructuring accelerated.
● Adjusted operating profit(2) was £1,813 million, up 11% from Q1 2015 but down 7% from Q2 2014,
principally driven by reduced income in Corporate & Institutional Banking (CIB) following the planned
scaling back of the business. Q2 2015 income benefited from a £205 million credit for IFRS volatility(3),
compared with a £123 million charge in Q1 2015. H1 2015 adjusted operating profit was £3,447
million, up 2% from H1 2014.
● Discontinued operations included a fair value gain of £517 million, of which £211 million was
attributable to RBS, reflecting the rise in market value of Citizens shares and broadly reversing the
loss recorded in Q1 2015.
● Tangible net asset value per ordinary and equivalent B share was 380p at 30 June 2015 compared
with 384p at 31 March 2015.
RBS is making good progress against its 2015 targets, moving faster in delivering its plan:
● Positive lending momentum across UK Personal & Business Banking (UK PBB) and Commercial
Banking.
● Statistically significant improvement in Net Promoter Scores (NPS) year-on-year in four of the seven
businesses where it is measured.
● Adjusted return on equity(4) in the Go-forward Bank is estimated at 14% for H1 2015.
● Capital position strengthened further with Common Equity Tier 1 ratio up 80 basis points in Q2 2015 to
12.3%.
● Exit Bank ahead of plan with continuing progress on sales and run-off.
● On track to achieve £800 million cost reduction target(5).
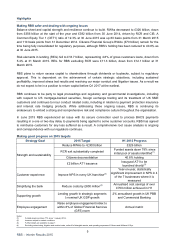
Creating a strong Go-forward Bank
RBS continues to target lending growth in strategic segments, UK PBB and Commercial Banking, in line with
or above nominal UK GDP growth. Annualised growth across these segments was 2% in H1 2015.
Investment in these businesses is paying dividends through improving returns.
Following a slow start to 2015, the updated mortgage platform enabled RBS to meet increased demand for
mortgage products through Q2 2015, with applications up 43% year-on-year and gross new lending up 43%
to £5.4 billion relative to the previous quarter. Market share of new mortgages reached 9.7% for Q2 2015,
well in excess of RBS’s current stock share of 8.3%. Commercial Banking increased loans and advances by
£1.4 billion year-on-year, excluding transfers, while continuing to run down non-strategic books.
Notes:
(1) Operating profit/(loss) before tax, own credit adjustments, gain on redemption of own debt and strategic disposals and includes the results of Citizens (excluding any fai
r
value adjustment) which are classified as discontinued operations in the statutory results. The half year and quarter ended 30 June 2014 are stated before RFS minority
interest.
(2) Excluding restructuring, litigation and conduct costs.
(3) IFRS volatility relates to loans which are economically hedged but for which hedge accounting is not permitted under IFRS.
(4) Calculated using operating profit after tax on a non-statutory basis excluding restructuring and litigation and conduct costs adjusted for preference share dividends divided
by average notional equity (based on 13% of average RWA equivalent (RWAe)).
(5) Excluding restructuring, litigation and conduct costs, write-off of intangible assets, and operating expenses of Citizens and Williams & Glyn.