RBS 2014 Annual Report Download - page 167
Download and view the complete annual report
Please find page 167 of the 2014 RBS annual report below. You can navigate through the pages in the report by either clicking on the pages listed below, or by using the keyword search tool below to find specific information within the annual report.-
 1
1 -
2
-
3
-
4
-
5
-
6
-
7
-
8
-
9
-
10
-
11
-
12
-
13
-
14
-
15
-
16
-
17
-
18
-
19
-
20
-
21
-
22
-
23
-
24
-
25
-
26
-
27
-
28
-
29
-
30
-
31
-
32
-
33
-
34
-
35
-
36
-
37
-
38
-
39
-
40
-
41
-
42
-
43
-
44
-
45
-
46
-
47
-
48
-
49
-
50
-
51
-
52
-
53
-
54
-
55
-
56
-
57
-
58
-
59
-
60
-
61
-
62
-
63
-
64
-
65
-
66
-
67
-
68
-
69
-
70
-
71
-
72
-
73
-
74
-
75
-
76
-
77
-
78
-
79
-
80
-
81
-
82
-
83
-
84
-
85
-
86
-
87
-
88
-
89
-
90
-
91
-
92
-
93
-
94
-
95
-
96
-
97
-
98
-
99
-
100
-
101
-
102
-
103
-
104
-
105
-
106
-
107
-
108
-
109
-
110
-
111
-
112
-
113
-
114
-
115
-
116
-
117
-
118
-
119
-
120
-
121
-
122
-
123
-
124
-
125
-
126
-
127
-
128
-
129
-
130
-
131
-
132
-
133
-
134
-
135
-
136
-
137
-
138
-
139
-
140
-
141
-
142
-
143
-
144
-
145
-
146
-
147
-
148
-
149
-
150
-
151
-
152
-
153
-
154
-
155
-
156
-
 157
157 -
 158
158 -
 159
159 -
 160
160 -
 161
161 -
 162
162 -
 163
163 -
 164
164 -
 165
165 -
 166
166 -
 167
167 -
 168
168 -
 169
169 -
 170
170 -
 171
171 -
 172
172 -
 173
173 -
 174
174 -
 175
175 -
 176
176 -
 177
177 -
178
-
179
-
180
-
181
-
182
-
183
-
184
-
185
-
186
-
187
-
188
-
189
-
190
-
191
-
192
-
193
-
194
-
195
-
196
-
197
-
198
-
199
 |
 |

32
RBS – Interim Results 2015
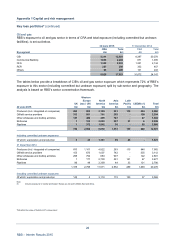
Appendix 1 Capital and risk management
Key points*
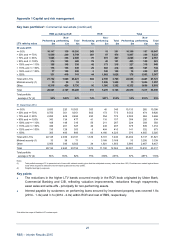
UK PBB
• The UK PBB personal mortgage portfolio increased by 2.1% to £105.4 billion, of which £92.5 billion
(31 December 2014 - £91.6 billion) was owner occupied and £12.9 billion (31 December 2014 - £11.6
billion) was buy-to-let. Of the total portfolio approximately £26 billion related to properties in the south
east of England, while £19 billion related to properties in Greater London.
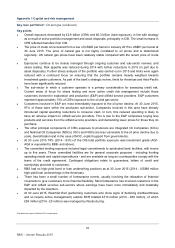
• Gross new mortgage lending amounted to £9.1 billion in H1 2015 with an average LTV by weighted
value of 70.4% (2014 - 70.5%). Lending to owner-occupiers during this period was £7.5 billion (2014 -
£16.6 billion) and had an average LTV by weighted value of 71.5% (2014 - 71.7%). Buy-to-let lending
was £1.6 billion (2014 - £3.1 billion) with an average LTV by weighted value of 65.1% (2014 - 63.9%).
• Based on the Halifax House Price Index at March 2015, the portfolio average indexed LTV by volume
was 50.4% (2014 - 50.4%) and 57.4% by weighted value of debt outstanding (2014 - 57.3%).
• Fixed interest rate products of varying time durations accounted for approximately 60% of the
mortgage portfolio with 3% a combination of fixed and variable rates and the remainder variable rate.
Approximately 17% of owner-occupied mortgages were on interest-only terms with a bullet repaymen
t
and 7% were on a combination of interest-only and capital and interest. The remainder were capital
and interest. 63% of the buy-to-let mortgages were on interest-only terms and 3% on a combination o
f
interest only and capital and interest.
• The arrears rate fell from 1.0% in December 2014 to 0.9% at the end of June 2015. The number o
f
properties repossessed in H1 2015 was also lower (338 compared with 472 in H2 2014). This reflected
improvements in the UK economy and underlying asset quality
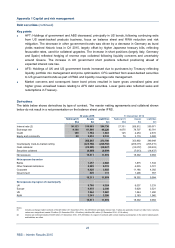
• The flow of new forbearance was £315 million in H1 2015 compared with £367 million in H2 2014. The
value of mortgages subject to forbearance has decreased by 8% since the year end to £4.5 billion
(equivalent to 4.2% of the total mortgage book) as a result of improved market conditions and
methodology changes.
• There was an overall small release of impairment provision for personal mortgages in H1 2015
compared with a small charge in H1 2014. Reduced REIL balances and a fall in the instances o
f
forborne mortgages drove the release in latent and PD90 provisions as well as lower LGDs.
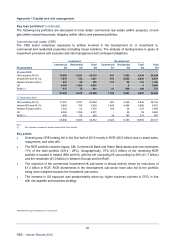
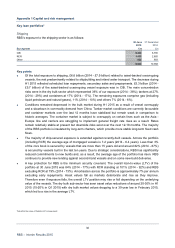
Ulster Bank
• Ulster Bank’s residential mortgage portfolio totalled £15.9 billion at 30 June 2015, with 86% in the
Republic of Ireland and 14% in Northern Ireland. Excluding the impact of exchange rate movements,
the portfolio decreased by 1.3% from 31 December 2014 as a result of amortisation a portion of which
related to the tracker mortgage portfolio. The volume of new business has increased reflecting
continuing market demand.
• The interest-rate product mix was approximately 63% of the mortgage portfolio on tracker-rate
products, 23% on variable-rate products and 14% on fixed rate. Interest-only represented 6% of the
total portfolio.
• The portfolio average indexed LTV decreased from 92% at 31 December 2014 to 89% at 30 June
2015 and reflected positive house price index trends over the last six months.
• At 30 June 2015, 22.3% of total mortgage assets (£3.6 billion) were subject to a forbearance
arrangement, a decrease of 8.3% (£0.3 billion) from 31 December 2014. Excluding the impact o
f
exchange rate movements, the value of mortgage assets subject to a forbearance arrangement has
decreased by £276 million (4.8%).
*Not within the scope of Deloitte LLP’s review report