RBS 2014 Annual Report Download - page 138
Download and view the complete annual report
Please find page 138 of the 2014 RBS annual report below. You can navigate through the pages in the report by either clicking on the pages listed below, or by using the keyword search tool below to find specific information within the annual report.-
 1
1 -
2
-
3
-
4
-
5
-
6
-
7
-
8
-
9
-
10
-
11
-
12
-
13
-
14
-
15
-
16
-
17
-
18
-
19
-
20
-
21
-
22
-
23
-
24
-
25
-
26
-
27
-
28
-
29
-
30
-
31
-
32
-
33
-
34
-
35
-
36
-
37
-
38
-
39
-
40
-
41
-
42
-
43
-
44
-
45
-
46
-
47
-
48
-
49
-
50
-
51
-
52
-
53
-
54
-
55
-
56
-
57
-
58
-
59
-
60
-
61
-
62
-
63
-
64
-
65
-
66
-
67
-
68
-
69
-
70
-
71
-
72
-
73
-
74
-
75
-
76
-
77
-
78
-
79
-
80
-
81
-
82
-
83
-
84
-
85
-
86
-
87
-
88
-
89
-
90
-
91
-
92
-
93
-
94
-
95
-
96
-
97
-
98
-
99
-
100
-
101
-
102
-
103
-
104
-
105
-
106
-
107
-
108
-
109
-
110
-
111
-
112
-
113
-
114
-
115
-
116
-
117
-
118
-
119
-
120
-
121
-
122
-
123
-
124
-
125
-
126
-
127
-
 128
128 -
 129
129 -
 130
130 -
 131
131 -
 132
132 -
 133
133 -
 134
134 -
 135
135 -
 136
136 -
 137
137 -
 138
138 -
 139
139 -
 140
140 -
 141
141 -
 142
142 -
 143
143 -
 144
144 -
 145
145 -
 146
146 -
 147
147 -
 148
148 -
149
-
150
-
151
-
152
-
153
-
154
-
155
-
156
-
157
-
158
-
159
-
160
-
161
-
162
-
163
-
164
-
165
-
166
-
167
-
168
-
169
-
170
-
171
-
172
-
173
-
174
-
175
-
176
-
177
-
178
-
179
-
180
-
181
-
182
-
183
-
184
-
185
-
186
-
187
-
188
-
189
-
190
-
191
-
192
-
193
-
194
-
195
-
196
-
197
-
198
-
199
 |
 |

3
RBS – Interim Results 2015
Appendix 1 Capital and risk management
General overview* (continued)
Risk type Overview
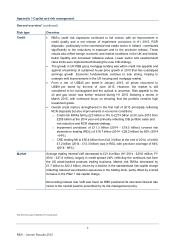
Credit • RBS’s credit risk exposures continued to fall overall, with an improvement in
credit quality and a net release of impairment provisions in H1 2015. RCR
disposals - particularly in the commercial real estate sector in Ireland - contributed
significantly to the reductions in exposure and to the provision release. These
results also reflect benign economic and market conditions in the UK and Ireland,
better liquidity and increased collateral values. Lower sector and asset/product
class limits were implemented following the new CIB strategy.
• The growth in UK PBB gross mortgage lending was within credit risk appetite and
against a backdrop of sustained house price growth in 2015 that has outstripped
earnings growth. Economic fundamentals continue to look strong, helping to
underpin mild improvements in the UK housing and mortgage market.
• From a low of US$45 per barrel in January 2015, oil prices recovered to
US$61 per barrel by the end of June 2015. However, the market is still
considered to be oversupplied and the outlook is uncertain. Risk appetite to the
oil and gas sector was further reduced during H1 2015 following a review in
March 2015, with continued focus on ensuring that the portfolio remains high
investment grade.
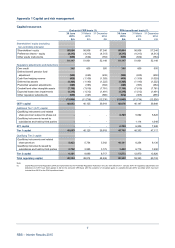
• Overall credit metrics strengthened in the first half of 2015 principally reflecting
RCR disposals but also improvements in economic conditions:
o Credit risk RWAs fell by £23 billion or 8% to £273 billion at 30 June 2015 from
£295 billion at the 2014 year end primarily reflecting CIB portfolio sales and
risk reduction and RCR disposal strategy.
o Impairment provisions of £11.3 billion (2014 - £18.0 billion) covered risk
elements in lending (REIL) of £18.7 billion (2014 - £28.2 billion) by 60% (2014
- 64%).
o CRE lending fell to £36.4 billion from £43.3 billion at the end of 2014, of which
£7.2 billion (2014 - £13.3 billion) was in REIL with provision coverage of 64%
(2014 - 68%).
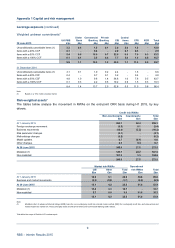
Market Average trading internal VaR decreased to £21.8 million (H1 2014 - £30.6 million; FY
2014 - £27.8 million), largely in credit spread VaR, reflecting the continued exit from
the US asset-backed products trading business. Market risk RWAs decreased by
£1.7 billion to £22.3 billion, driven by a decline in the standardised risk capital charge
reflecting reduced securitisation exposures in the trading book, partly offset by a small
increase in the Pillar 1 risk capital charge.
Non-trading interest rate VaR was lower as RBS positioned its structural interest rate
closer to the neutral position prescribed by its risk management policy
*Not within the scope of Deloitte LLP’s review report