RBS 2014 Annual Report Download - page 7
Download and view the complete annual report
Please find page 7 of the 2014 RBS annual report below. You can navigate through the pages in the report by either clicking on the pages listed below, or by using the keyword search tool below to find specific information within the annual report.-
 1
1 -
 2
2 -
 3
3 -
 4
4 -
 5
5 -
 6
6 -
 7
7 -
 8
8 -
 9
9 -
 10
10 -
 11
11 -
 12
12 -
 13
13 -
 14
14 -
 15
15 -
 16
16 -
 17
17 -
 18
18 -
19
-
20
-
21
-
22
-
23
-
24
-
25
-
26
-
27
-
28
-
29
-
30
-
31
-
32
-
33
-
34
-
35
-
36
-
37
-
38
-
39
-
40
-
41
-
42
-
43
-
44
-
45
-
46
-
47
-
48
-
49
-
50
-
51
-
52
-
53
-
54
-
55
-
56
-
57
-
58
-
59
-
60
-
61
-
62
-
63
-
64
-
65
-
66
-
67
-
68
-
69
-
70
-
71
-
72
-
73
-
74
-
75
-
76
-
77
-
78
-
79
-
80
-
81
-
82
-
83
-
84
-
85
-
86
-
87
-
88
-
89
-
90
-
91
-
92
-
93
-
94
-
95
-
96
-
97
-
98
-
99
-
100
-
101
-
102
-
103
-
104
-
105
-
106
-
107
-
108
-
109
-
110
-
111
-
112
-
113
-
114
-
115
-
116
-
117
-
118
-
119
-
120
-
121
-
122
-
123
-
124
-
125
-
126
-
127
-
128
-
129
-
130
-
131
-
132
-
133
-
134
-
135
-
136
-
137
-
138
-
139
-
140
-
141
-
142
-
143
-
144
-
145
-
146
-
147
-
148
-
149
-
150
-
151
-
152
-
153
-
154
-
155
-
156
-
157
-
158
-
159
-
160
-
161
-
162
-
163
-
164
-
165
-
166
-
167
-
168
-
169
-
170
-
171
-
172
-
173
-
174
-
175
-
176
-
177
-
178
-
179
-
180
-
181
-
182
-
183
-
184
-
185
-
186
-
187
-
188
-
189
-
190
-
191
-
192
-
193
-
194
-
195
-
196
-
197
-
198
-
199
 |
 |

5
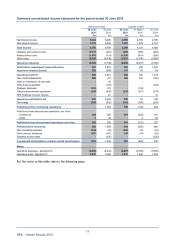
RBS – Interim Results 2015
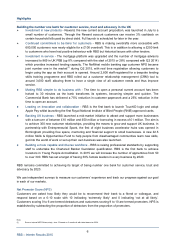
Highlights
Making RBS safer and dealing with ongoing issues
Balance sheet and capital strength and resilience continue to build. RWAs decreased to £326 billion, down
from £356 billion at the start of the year and £392 billion from 30 June 2014, driven by RCR and CIB. A
Common Equity Tier 1 (CET1) ratio of 12.3% at 30 June 2015 was up 80 basis points from 31 March 2015
and 110 basis points from 31 December 2014. Citizens Financial Group’s RWAs (£70 billion) remain for the
time being fully consolidated for regulatory purposes, although RBS’s holding has been reduced to 40.8% as
at 30 June 2015.
Risk elements in lending (REIL) fell to £18.7 billion, representing 4.8% of gross customers loans, down from
5.4% at 31 March 2015. REIL for RBS excluding RCR were £11.3 billion, down from £12.1 billion at 31
March 2015.
RBS plans to return excess capital to shareholders through dividends or buybacks, subject to regulatory
approval. This is dependent on the achievement of certain strategic objectives, including sustained
profitability, improved stress test results and resolving our major conduct and litigation issues. As a result we
do not expect to be in a position to return capital before Q1 2017 at the earliest.
RBS continues to be party to legal proceedings and regulatory and governmental investigations, including
with respect to US mortgage-backed securities, foreign exchange trading and its treatment of UK SME
customers and continues to incur conduct related costs, including in relation to payment protection insurance
and interest rate hedging products. While addressing these ongoing issues, RBS is continuing its
endeavours to embed a strong and comprehensive risk and compliance culture throughout the organisation.
In June 2015 RBS experienced an issue with its secure connection used to process BACS payments
resulting in a one or two day delay to payments being applied to some customer accounts. RBS has agreed
to reimburse customers for any loss suffered as a result. A comprehensive root cause analysis is ongoing
and correspondence with our regulators continues.
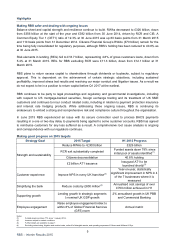
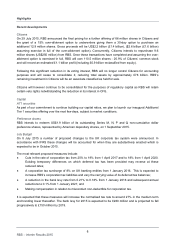
Making good progress on 2015 targets
Strategy Goal 2015 Target H1 2015 Progress
Reduce RWAs to <£300 billion £326 billion
RCR exit substantially completed Funded assets down 78% since
initial pool of assets identified(1)
Citizens deconsolidation 40.8% holding
Strength and sustainability
£2 billion AT1 issuance Inaugural AT1 to be
launched shortly(2)
Customer experience Improve NPS in every UK franchise(3)
Year-on-year, statistically
significant improvement in NPS in 4
of the 7 businesses where it is
measured
Simplifying the bank Reduce costs by £800 million(4) Annualised cost savings of over
£700 million achieved in H1
Supporting growth Lending growth in strategic segments
≥ nominal UK GDP growth
2% annualised growth in UK PBB
and Commercial Banking
Employee engagement
Raise employee engagement index to
within 8% of Global Financial Services
(GFS) norm
Annual metric
Notes:
(1) Funded assets are down 71% since 1 January 2014.
(2) Issuance subject to market conditions.
(3) Further details are available on page 7.
(4) Excluding restructuring, litigation and conduct costs, write-off of intangible assets, and operating expenses of Citizens and Williams & Glyn.