RBS 2014 Annual Report Download - page 56
Download and view the complete annual report
Please find page 56 of the 2014 RBS annual report below. You can navigate through the pages in the report by either clicking on the pages listed below, or by using the keyword search tool below to find specific information within the annual report.-
 1
1 -
2
-
3
-
4
-
5
-
6
-
7
-
8
-
9
-
10
-
11
-
12
-
13
-
14
-
15
-
16
-
17
-
18
-
19
-
20
-
21
-
22
-
23
-
24
-
25
-
26
-
27
-
28
-
29
-
30
-
31
-
32
-
33
-
34
-
35
-
36
-
37
-
38
-
39
-
40
-
41
-
42
-
43
-
44
-
45
-
 46
46 -
 47
47 -
 48
48 -
 49
49 -
 50
50 -
 51
51 -
 52
52 -
 53
53 -
 54
54 -
 55
55 -
 56
56 -
 57
57 -
 58
58 -
 59
59 -
 60
60 -
 61
61 -
 62
62 -
 63
63 -
 64
64 -
 65
65 -
 66
66 -
67
-
68
-
69
-
70
-
71
-
72
-
73
-
74
-
75
-
76
-
77
-
78
-
79
-
80
-
81
-
82
-
83
-
84
-
85
-
86
-
87
-
88
-
89
-
90
-
91
-
92
-
93
-
94
-
95
-
96
-
97
-
98
-
99
-
100
-
101
-
102
-
103
-
104
-
105
-
106
-
107
-
108
-
109
-
110
-
111
-
112
-
113
-
114
-
115
-
116
-
117
-
118
-
119
-
120
-
121
-
122
-
123
-
124
-
125
-
126
-
127
-
128
-
129
-
130
-
131
-
132
-
133
-
134
-
135
-
136
-
137
-
138
-
139
-
140
-
141
-
142
-
143
-
144
-
145
-
146
-
147
-
148
-
149
-
150
-
151
-
152
-
153
-
154
-
155
-
156
-
157
-
158
-
159
-
160
-
161
-
162
-
163
-
164
-
165
-
166
-
167
-
168
-
169
-
170
-
171
-
172
-
173
-
174
-
175
-
176
-
177
-
178
-
179
-
180
-
181
-
182
-
183
-
184
-
185
-
186
-
187
-
188
-
189
-
190
-
191
-
192
-
193
-
194
-
195
-
196
-
197
-
198
-
199
 |
 |

54
RBS – Interim Results 2015
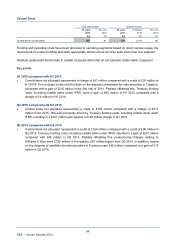
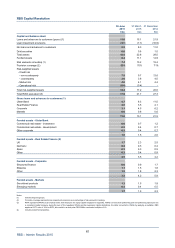
Central items
Half year ended Quarter ended
30 June 30 June 30 June 31 March 30 June
2015 2014 2015 2015 2014
£m £m £m £m £m
Central items not allocated (47) 91 164 (211) 86
Funding and operating costs have been allocated to operating segments based on direct service usage, the
requirement for market funding and other appropriate drivers where services span more than one segment.
Residual unallocated items relate to volatile corporate items that do not naturally reside within a segment.
Key points
H1 2015 compared with H1 2014
• Central items not allocated represented a charge of £47 million compared with a credit of £91 million in
H1 2014. This includes a loss of £69 million on the disposal of available-for-sale securities in Treasury,
compared with a gain of £215 million in the first half of 2014. Partially offsetting this, Treasury funding
costs, including volatile items under IFRS, were a gain of £93 million in H1 2015 compared with a
charge of £4 million in H1 2014.
Q2 2015 compared with Q1 2015
• Central items not allocated represented a credit of £164 million compared with a charge of £211
million in Q1 2015. This was principally driven by Treasury funding costs, including volatile items unde
r
IFRS, resulting in a £201 million gain against a £108 million charge in Q1 2015.
Q2 2015 compared with Q2 2014
• Central items not allocated represented a credit of £164 million compared with a credit of £86 million in
Q2 2014. Treasury funding costs, including volatile items under IFRS, resulted in a gain of £201 million
compared with £46 million in Q2 2014. Partially offsetting this, restructuring charges relating to
Williams & Glyn were £126 million in the quarter, £67 million higher than Q2 2014. In addition, losses
on the disposal of available-for-sale securities in Treasury were £42 million compared to a gain of £13
million in Q2 2014.