RBS 2014 Annual Report Download - page 162
Download and view the complete annual report
Please find page 162 of the 2014 RBS annual report below. You can navigate through the pages in the report by either clicking on the pages listed below, or by using the keyword search tool below to find specific information within the annual report.-
 1
1 -
2
-
3
-
4
-
5
-
6
-
7
-
8
-
9
-
10
-
11
-
12
-
13
-
14
-
15
-
16
-
17
-
18
-
19
-
20
-
21
-
22
-
23
-
24
-
25
-
26
-
27
-
28
-
29
-
30
-
31
-
32
-
33
-
34
-
35
-
36
-
37
-
38
-
39
-
40
-
41
-
42
-
43
-
44
-
45
-
46
-
47
-
48
-
49
-
50
-
51
-
52
-
53
-
54
-
55
-
56
-
57
-
58
-
59
-
60
-
61
-
62
-
63
-
64
-
65
-
66
-
67
-
68
-
69
-
70
-
71
-
72
-
73
-
74
-
75
-
76
-
77
-
78
-
79
-
80
-
81
-
82
-
83
-
84
-
85
-
86
-
87
-
88
-
89
-
90
-
91
-
92
-
93
-
94
-
95
-
96
-
97
-
98
-
99
-
100
-
101
-
102
-
103
-
104
-
105
-
106
-
107
-
108
-
109
-
110
-
111
-
112
-
113
-
114
-
115
-
116
-
117
-
118
-
119
-
120
-
121
-
122
-
123
-
124
-
125
-
126
-
127
-
128
-
129
-
130
-
131
-
132
-
133
-
134
-
135
-
136
-
137
-
138
-
139
-
140
-
141
-
142
-
143
-
144
-
145
-
146
-
147
-
148
-
149
-
150
-
151
-
 152
152 -
 153
153 -
 154
154 -
 155
155 -
 156
156 -
 157
157 -
 158
158 -
 159
159 -
 160
160 -
 161
161 -
 162
162 -
 163
163 -
 164
164 -
 165
165 -
 166
166 -
 167
167 -
 168
168 -
 169
169 -
 170
170 -
 171
171 -
 172
172 -
173
-
174
-
175
-
176
-
177
-
178
-
179
-
180
-
181
-
182
-
183
-
184
-
185
-
186
-
187
-
188
-
189
-
190
-
191
-
192
-
193
-
194
-
195
-
196
-
197
-
198
-
199
 |
 |

27
RBS – Interim Results 2015
Appendix 1 Capital and risk management
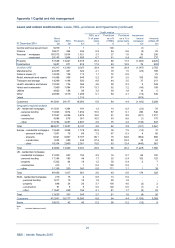
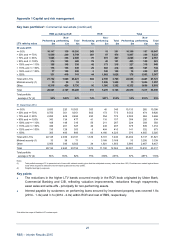
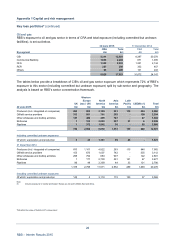
Key loan portfolios*: Commercial real estate (continued)
RBS excluding RCR RCR Total
Non- Non- Non-
Performing performing Total Performing performing Total Performing performing Total
LTV ratio by value £m £m £m £m £m £m £m £m £m
30 June 2015
<= 50% 10,147 139 10,286 243 18 261 10,390 157 10,547
> 50% and <= 70% 8,500 249 8,749 387 87 474 8,887 336 9,223
> 70% and <= 90% 1,944 356 2,300 76 391 467 2,020 747 2,767
> 90% and <= 100% 374 106 480 79 42 121 453 148 601
> 100% and <= 110% 185 145 330 42 173 215 227 318 545
> 110% and <= 130% 174 156 330 29 385 414 203 541 744
> 130% and <= 150% 77 128 205 2 120 122 79 248 327
> 150% 331 410 741 44 1,582 1,626 375 1,992 2,367
Total with LTVs 21,732 1,689 23,421 902 2,798 3,700 22,634 4,487 27,121
Minimal security (1) 13 38 51 - 1,206 1,206 13 1,244 1,257
Other 6,316 420 6,736 16 1,266 1,282 6,332 1,686 8,018
Total 28,061 2,147 30,208 918 5,270 6,188 28,979 7,417 36,396
Total portfolio
average LTV (2) 56% 140% 62% 74% 287% 236% 56% 232% 85%
31 December 2014
<= 50% 9,833 220 10,053 300 45 345 10,133 265 10,398
> 50% and <= 70% 8,750 301 9,051 602 173 775 9,352 474 9,826
> 70% and <= 90% 2,285 409 2,694 220 554 774 2,505 963 3,468
> 90% and <= 100% 343 134 477 41 116 157 384 250 634
> 100% and <= 110% 168 148 316 56 211 267 224 359 583
> 110% and <= 130% 326 201 527 49 438 487 375 639 1,014
> 130% and <= 150% 135 128 263 6 404 410 141 532 673
> 150% 305 495 800 65 4,160 4,225 370 4,655 5,025
Total with LTVs 22,145 2,036 24,181 1,339 6,101 7,440 23,484 8,137 31,621
Minimal security (1) 33 38 71 - 3,168 3,168 33 3,206 3,239
Other 5,956 546 6,502 34 1,921 1,955 5,990 2,467 8,457
Total 28,134 2,620 30,754 1,373 11,190 12,563 29,507 13,810 43,317
Total portfolio
average LTV (2) 56% 133% 62% 75% 338% 291% 57% 287% 116%
Notes:
(1) Total portfolio average LTV is presented net of loans with minimal security given that the anticipated recovery rate is less than 10%. Provisions are marked against these
loans where required to reflect the relevant asset quality and recovery profile.
(2) Weighted average by exposure.
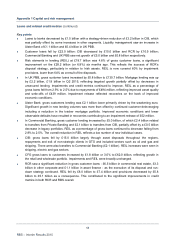
Key points
• The reductions in the higher LTV bands occurred mostly in the RCR book originated by Ulster Bank,
Commercial Banking and CIB, reflecting valuation improvements, reductions through repayments,
asset sales and write-offs - principally for non-performing assets.
• Interest payable by customers on performing loans secured by investment property was covered 1.8x
(2014 - 1. 6x) and 3.1x (2014 - 2.9x) within RCR and rest of RBS, respectively.
*Not within the scope of Deloitte LLP’s review report