RBS 2014 Annual Report Download - page 29
Download and view the complete annual report
Please find page 29 of the 2014 RBS annual report below. You can navigate through the pages in the report by either clicking on the pages listed below, or by using the keyword search tool below to find specific information within the annual report.-
 1
1 -
2
-
3
-
4
-
5
-
6
-
7
-
8
-
9
-
10
-
11
-
12
-
13
-
14
-
15
-
16
-
17
-
18
-
 19
19 -
 20
20 -
 21
21 -
 22
22 -
 23
23 -
 24
24 -
 25
25 -
 26
26 -
 27
27 -
 28
28 -
 29
29 -
 30
30 -
 31
31 -
 32
32 -
 33
33 -
 34
34 -
 35
35 -
 36
36 -
 37
37 -
 38
38 -
 39
39 -
40
-
41
-
42
-
43
-
44
-
45
-
46
-
47
-
48
-
49
-
50
-
51
-
52
-
53
-
54
-
55
-
56
-
57
-
58
-
59
-
60
-
61
-
62
-
63
-
64
-
65
-
66
-
67
-
68
-
69
-
70
-
71
-
72
-
73
-
74
-
75
-
76
-
77
-
78
-
79
-
80
-
81
-
82
-
83
-
84
-
85
-
86
-
87
-
88
-
89
-
90
-
91
-
92
-
93
-
94
-
95
-
96
-
97
-
98
-
99
-
100
-
101
-
102
-
103
-
104
-
105
-
106
-
107
-
108
-
109
-
110
-
111
-
112
-
113
-
114
-
115
-
116
-
117
-
118
-
119
-
120
-
121
-
122
-
123
-
124
-
125
-
126
-
127
-
128
-
129
-
130
-
131
-
132
-
133
-
134
-
135
-
136
-
137
-
138
-
139
-
140
-
141
-
142
-
143
-
144
-
145
-
146
-
147
-
148
-
149
-
150
-
151
-
152
-
153
-
154
-
155
-
156
-
157
-
158
-
159
-
160
-
161
-
162
-
163
-
164
-
165
-
166
-
167
-
168
-
169
-
170
-
171
-
172
-
173
-
174
-
175
-
176
-
177
-
178
-
179
-
180
-
181
-
182
-
183
-
184
-
185
-
186
-
187
-
188
-
189
-
190
-
191
-
192
-
193
-
194
-
195
-
196
-
197
-
198
-
199
 |
 |
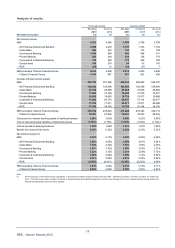
27
RBS – Interim Results 2015
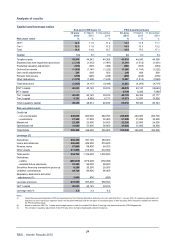
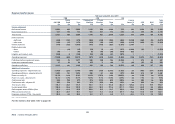
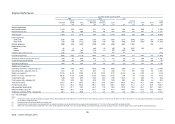
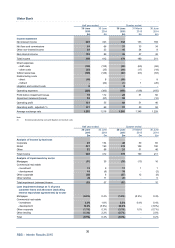
Segment performance
Quarter ended 30 June 2015
PBB CPB CIB
Ulste
r
Commercial Private Central Total
UK PBB Bank Total Banking Banking Total items (1) CFG RCR RBS
£m £m £m £m £m £m £m £m £m £m £m
Income statement
Net interest income 1,147 132 1,279 562 126 688 174 88 551 (14) 2,766
Non-interest income 322 46 368 330 81 411 346 173 246 59 1,603
Total income 1,469 178 1,647 892 207 1,099 520 261 797 45 4,369
Direct expenses
- staff costs (231) (60) (291) (126) (67) (193) (142) (585) (275) (31) (1,517)
- other costs (69) (16) (85) (56) (14) (70) (71) (732) (215) (7) (1,180)
Indirect expenses (463) (63) (526) (208) (96) (304) (521) 1,366 - (15) -
Restructuring costs
- direct - (18) (18) (10) (3) (13) (195) (797) (27) - (1,050)
- indirect (20) (1) (21) (7) (81) (88) (539) 648 - - -
Litigation and conduct costs (10) 8(2) (59) (26) (85) (373) 1- - (459)
Operating expenses (793) (150) (943) (466) (287) (753) (1,841) (99) (517) (53) (4,206)
Profit/(loss) before impairment losses 676 28 704 426 (80) 346 (1,321) 162 280 (8) 163
Impairment (losses)/releases (9) 52 43 (26) 2 (24) (13) 2(51) 184 141
Operating profit/(loss) 667 80 747 400 (78) 322 (1,334) 164 229 176 304
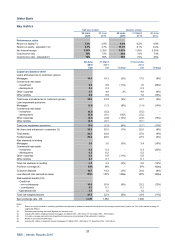
Additional information
Operating expenses - adjusted (£m) (2) (763) (139) (902) (390) (177) (567) (734) 49 (490) (53) (2,697)
Operating profit/(loss) - adjusted (£m) (2) 697 91 788 476 32 508 (227) 312 256 176 1,813
Return on equity (3) 32.1% 9.9% 24.7% 11.3% (20.1%) 7.5% (33.0%) nm 6.5% nm 2.7%
Return on equity - adjusted (2,3) 33.6% 11.3% 26.1% 13.7% 5.6% 12.7% (6.9%) nm 7.2% nm 14.1%
Cost:income ratio 54% 84% 57% 52% 139% 69% 354% nm 65% nm 96%
Cost:income ratio - adjusted (2) 52% 78% 55% 44% 86% 52% 141% nm 62% nm 62%
Total assets (£bn) 135.4 26.5 161.9 94.5 17.0 111.5 482.4 105.2 87.2 16.5 964.7
Funded assets (£bn) 135.4 26.4 161.8 94.5 16.9 111.4 211.1 102.9 86.8 8.4 682.4
Risk-weighted assets (RWAs) (£bn) 41.0 21.2 62.2 66.9 9.8 76.7 88.0 15.3 69.8 14.4 326.4
RWA equivalent (£bn) (4) 44.6 20.7 65.3 72.0 9.8 81.8 89.7 15.4 70.0 17.9 340.1
Employee numbers (FTEs - thousands) 25.4 4.2 29.6 6.2 2.7 8.9 3.1 49.5 17.6 0.5 109.2
nm = not meaningful
For the notes to this table refer to page 30.