RBS 2014 Annual Report Download - page 86
Download and view the complete annual report
Please find page 86 of the 2014 RBS annual report below. You can navigate through the pages in the report by either clicking on the pages listed below, or by using the keyword search tool below to find specific information within the annual report.-
 1
1 -
2
-
3
-
4
-
5
-
6
-
7
-
8
-
9
-
10
-
11
-
12
-
13
-
14
-
15
-
16
-
17
-
18
-
19
-
20
-
21
-
22
-
23
-
24
-
25
-
26
-
27
-
28
-
29
-
30
-
31
-
32
-
33
-
34
-
35
-
36
-
37
-
38
-
39
-
40
-
41
-
42
-
43
-
44
-
45
-
46
-
47
-
48
-
49
-
50
-
51
-
52
-
53
-
54
-
55
-
56
-
57
-
58
-
59
-
60
-
61
-
62
-
63
-
64
-
65
-
66
-
67
-
68
-
69
-
70
-
71
-
72
-
73
-
74
-
75
-
 76
76 -
 77
77 -
 78
78 -
 79
79 -
 80
80 -
 81
81 -
 82
82 -
 83
83 -
 84
84 -
 85
85 -
 86
86 -
 87
87 -
 88
88 -
 89
89 -
 90
90 -
 91
91 -
 92
92 -
 93
93 -
 94
94 -
 95
95 -
 96
96 -
97
-
98
-
99
-
100
-
101
-
102
-
103
-
104
-
105
-
106
-
107
-
108
-
109
-
110
-
111
-
112
-
113
-
114
-
115
-
116
-
117
-
118
-
119
-
120
-
121
-
122
-
123
-
124
-
125
-
126
-
127
-
128
-
129
-
130
-
131
-
132
-
133
-
134
-
135
-
136
-
137
-
138
-
139
-
140
-
141
-
142
-
143
-
144
-
145
-
146
-
147
-
148
-
149
-
150
-
151
-
152
-
153
-
154
-
155
-
156
-
157
-
158
-
159
-
160
-
161
-
162
-
163
-
164
-
165
-
166
-
167
-
168
-
169
-
170
-
171
-
172
-
173
-
174
-
175
-
176
-
177
-
178
-
179
-
180
-
181
-
182
-
183
-
184
-
185
-
186
-
187
-
188
-
189
-
190
-
191
-
192
-
193
-
194
-
195
-
196
-
197
-
198
-
199
 |
 |
84
RBS – Interim Results 2015
Notes
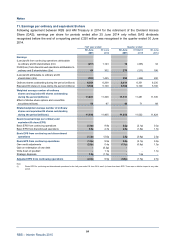
11. Earnings per ordinary and equivalent B share
Following agreement between RBS and HM Treasury in 2014 for the retirement of the Dividend Access
Share (DAS), earnings per share for periods ended after 25 June 2014 only reflect DAS dividends
recognised before the end of a reporting period: £320 million was recognised in the quarter ended 30 June
2014.
Half year ended Quarter ended
30 June 30 June 30 June 31 March 30 June
2015 2014 2015 2015 2014
Earnings
(Loss)/profit from continuing operations attributable
to ordinary and B shareholders (£m) (217) 1,123 18 (235) 34
Profit/(loss) from discontinued operations attributable to
ordinary and B shareholders (£m) 64 302 275 (211) 196
(Loss)/profit attributable to ordinary and B
shareholders (£m) (153) 1,425 293 (446) 230
Ordinary shares outstanding during the period (millions) 6,381 6,208 6,411 6,351 6,235
Equivalent B shares in issue during the period (millions) 5,100 5,100 5,100 5,100 5,100
Weighted average number of ordinary
shares and equivalent B shares outstanding
during the period (millions) 11,481 11,308 11,511 11,451 11,335
Effect of dilutive share options and convertible
securities (millions) 59 97 48 71 89
Diluted weighted average number of ordinary
shares and equivalent B shares outstanding
during the period (millions) 11,540 11,405 11,559 11,522 11,424
Basic (loss)/earnings per ordinary and
equivalent B share (EPS)
Basic EPS from continuing operations (1.9p) 9.9p 0.2p (2.1p) 0.3p
Basic EPS from discontinued operations 0.6p 2.7p 2.3p (1.8p) 1.7p
Basic EPS from continuing and discontinued
operations (1.3p) 12.6p 2.5p (3.9p) 2.0p
Basic EPS from continuing operations (1.9p) 9.9p 0.2p (2.1p) 0.3p
Own credit adjustments (2.0p) 0.4p (1.1p) (0.8p) 1.3p
Gain on redemption of own debt - (0.2p) - - -
Write down of goodwill - 1.1p - - 1.1p
Strategic disposals 1.2p (1.7p) - 1.2p -
Adjusted EPS from continuing operations (2.7p) 9.5p (0.9p) (1.7p) 2.7p
Note:
(1) Diluted EPS for continuing and discontinued operations for the half year ended 30 June 2014 was 0.1p lower than basic EPS. There was no dilutive impact in any othe
r
period.