RBS 2014 Annual Report Download - page 41
Download and view the complete annual report
Please find page 41 of the 2014 RBS annual report below. You can navigate through the pages in the report by either clicking on the pages listed below, or by using the keyword search tool below to find specific information within the annual report.-
 1
1 -
2
-
3
-
4
-
5
-
6
-
7
-
8
-
9
-
10
-
11
-
12
-
13
-
14
-
15
-
16
-
17
-
18
-
19
-
20
-
21
-
22
-
23
-
24
-
25
-
26
-
27
-
28
-
29
-
30
-
 31
31 -
 32
32 -
 33
33 -
 34
34 -
 35
35 -
 36
36 -
 37
37 -
 38
38 -
 39
39 -
 40
40 -
 41
41 -
 42
42 -
 43
43 -
 44
44 -
 45
45 -
 46
46 -
 47
47 -
 48
48 -
 49
49 -
 50
50 -
 51
51 -
52
-
53
-
54
-
55
-
56
-
57
-
58
-
59
-
60
-
61
-
62
-
63
-
64
-
65
-
66
-
67
-
68
-
69
-
70
-
71
-
72
-
73
-
74
-
75
-
76
-
77
-
78
-
79
-
80
-
81
-
82
-
83
-
84
-
85
-
86
-
87
-
88
-
89
-
90
-
91
-
92
-
93
-
94
-
95
-
96
-
97
-
98
-
99
-
100
-
101
-
102
-
103
-
104
-
105
-
106
-
107
-
108
-
109
-
110
-
111
-
112
-
113
-
114
-
115
-
116
-
117
-
118
-
119
-
120
-
121
-
122
-
123
-
124
-
125
-
126
-
127
-
128
-
129
-
130
-
131
-
132
-
133
-
134
-
135
-
136
-
137
-
138
-
139
-
140
-
141
-
142
-
143
-
144
-
145
-
146
-
147
-
148
-
149
-
150
-
151
-
152
-
153
-
154
-
155
-
156
-
157
-
158
-
159
-
160
-
161
-
162
-
163
-
164
-
165
-
166
-
167
-
168
-
169
-
170
-
171
-
172
-
173
-
174
-
175
-
176
-
177
-
178
-
179
-
180
-
181
-
182
-
183
-
184
-
185
-
186
-
187
-
188
-
189
-
190
-
191
-
192
-
193
-
194
-
195
-
196
-
197
-
198
-
199
 |
 |

39
RBS – Interim Results 2015
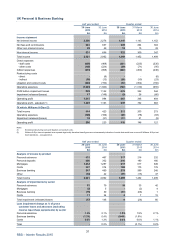
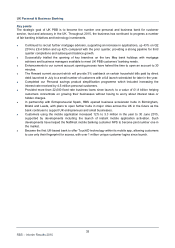
Ulster Bank
Key points (continued)
H1 2015 compared with H1 2014 (continued)
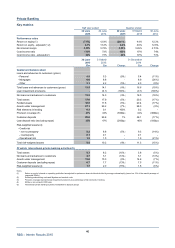
• The significant growth in new lending volumes has been offset by continued customer deleveraging.
The loan:deposit ratio was steady over the period with the weakening euro driving reductions in the
reported net loans and advances to customers and customer deposit balances. The low yielding
tracker mortgage portfolio declined by a further £1.1 billion, or 10% during H1 2015 to £9.4 billion
reflecting customer repayments and the weakening of the euro.
• RWAs reduced by £2.6 billion during H1 2015 to £21.2 billion reflecting an improvement in credit
metrics and the impact of exchange rate movements, contributing to the improvement in return on
equity. £1.5 billion of the RWA reduction related to the tracker mortgage portfolio which now totals
£8.1 billion.
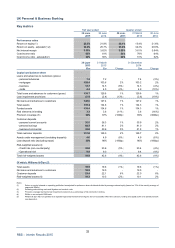
Q2 2015 compared with Q1 2015
• Operating profit increased by £29 million to £80 million due primarily to impairment releases, partly
offset by lower income and higher restructuring costs. Adjusted operating profit was £91 million for Q2
2015 compared with an operating profit of £50 million for Q1 2015.
• Total income decreased by £12 million to £178 million primarily driven by the weakening of the euro
(an impact of £4 million) and a lower return on free funds. Operating expenses increased by £11
million with the impact of higher restructuring costs partly offset by a release of provision reflecting the
outcome of reviews on Interest Rate Hedging Products.
Q2 2015 compared with Q2 2014
• Operating profit increased by £34 million to £80 million driven by impairment releases and lowe
r
expenses, partly offset by lower income. Adjusted operating profit increased by £33 million to £91
million.
• Total income decreased by £33 million primarily driven by exchange rate movements (an impact o
f
£17 million) and a lower return on free funds. Operating expenses decreased by £5 million reflecting
the continued focus on cost management.