RBS 2014 Annual Report Download - page 54
Download and view the complete annual report
Please find page 54 of the 2014 RBS annual report below. You can navigate through the pages in the report by either clicking on the pages listed below, or by using the keyword search tool below to find specific information within the annual report.-
 1
1 -
2
-
3
-
4
-
5
-
6
-
7
-
8
-
9
-
10
-
11
-
12
-
13
-
14
-
15
-
16
-
17
-
18
-
19
-
20
-
21
-
22
-
23
-
24
-
25
-
26
-
27
-
28
-
29
-
30
-
31
-
32
-
33
-
34
-
35
-
36
-
37
-
38
-
39
-
40
-
41
-
42
-
43
-
 44
44 -
 45
45 -
 46
46 -
 47
47 -
 48
48 -
 49
49 -
 50
50 -
 51
51 -
 52
52 -
 53
53 -
 54
54 -
 55
55 -
 56
56 -
 57
57 -
 58
58 -
 59
59 -
 60
60 -
 61
61 -
 62
62 -
 63
63 -
 64
64 -
65
-
66
-
67
-
68
-
69
-
70
-
71
-
72
-
73
-
74
-
75
-
76
-
77
-
78
-
79
-
80
-
81
-
82
-
83
-
84
-
85
-
86
-
87
-
88
-
89
-
90
-
91
-
92
-
93
-
94
-
95
-
96
-
97
-
98
-
99
-
100
-
101
-
102
-
103
-
104
-
105
-
106
-
107
-
108
-
109
-
110
-
111
-
112
-
113
-
114
-
115
-
116
-
117
-
118
-
119
-
120
-
121
-
122
-
123
-
124
-
125
-
126
-
127
-
128
-
129
-
130
-
131
-
132
-
133
-
134
-
135
-
136
-
137
-
138
-
139
-
140
-
141
-
142
-
143
-
144
-
145
-
146
-
147
-
148
-
149
-
150
-
151
-
152
-
153
-
154
-
155
-
156
-
157
-
158
-
159
-
160
-
161
-
162
-
163
-
164
-
165
-
166
-
167
-
168
-
169
-
170
-
171
-
172
-
173
-
174
-
175
-
176
-
177
-
178
-
179
-
180
-
181
-
182
-
183
-
184
-
185
-
186
-
187
-
188
-
189
-
190
-
191
-
192
-
193
-
194
-
195
-
196
-
197
-
198
-
199
 |
 |

52
RBS – Interim Results 2015
Corporate & Institutional Banking
Key points (continued)
H1 2015 compared with H1 2014 (continued)
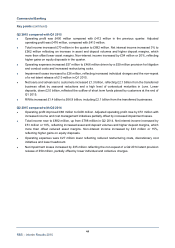
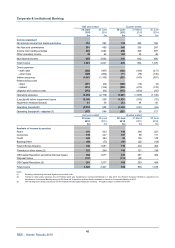
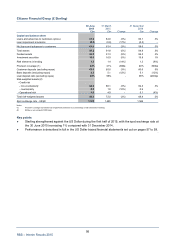
● Operating expenses increased from £2,158 million to £3,430 million in H1 2015 due to a higher level
of litigation and conduct costs and restructuring costs The increased restructuring costs of £1,025
million reflect February’s strategic announcement and were driven by the write-down of intangible
assets totalling £521 million and provision for staff redundancies, as the business strives to become a
smaller, simpler bank. Adjusted expenses fell by 20% to £1,532 million as headcount continued to be
reduced and discretionary expenditure tightly controlled.
● RWAs fell substantially, from £128 billion at 30 June 2014 to £88 billion at 30 June 2015 reflecting the
ongoing drive to reduce both the scale and risk of the business. This was reinforced by the creation o
f
CIB Capital Resolution where an acceleration of disposals means RWAs have fallen by £19 billion
since 31 December 2014 and are ahead of plan. CIB is on track to deliver the previously announced
target of a £25 billion reduction in 2015.
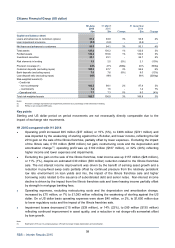
Q2 2015 compared with Q1 2015
● Operating loss increased by £593 million to £1,334 million, reflecting lower income and highe
r
restructuring costs, partially offset by lower litigation and conduct costs. Adjusted operating loss was
£227 million compared with a profit of £50 million in Q1 2015 as the reduction in adjusted expenses
was more than offset by lower income.
● Total income fell by £284 million to £520 million. This was driven by the wind down of CIB Capital
Resolution where: Markets income fell from £94 million in Q1 2015 to £21 million in Q2 2015; Portfolio
income increased from £80 million in Q1 2015 to £85 million in Q2 2015; Transaction Services income
fell from £126 million in Q1 2015 to £104 million in Q2 2015; disposal losses increased from £28
million in Q1 2015 to £113 million in Q2 2015. CIB Go-forward income declined by 28% from £430
million to £310 million, driven by uncertainty in European markets, impacting both rates trading and
debt capital market issuance.
● Operating expenses increased by £252 million to £1,841 million as a lower level of litigation and
conduct expenses was more than offset by higher restructuring costs. Adjusted expenses fell by £64
million to £734 million due to ongoing reductions in both headcount and discretionary expenditure.
● RWAs fell by £15 billion to £88 billion, £13 billion of which was in CIB Capital Resolution driven by
reductions in both the loan portfolio and the trading book.
Q2 2015 compared with Q2 2014
● Operating loss totalled £1,334 million, compared with £25 million in Q2 2014. This reflected lowe
r
income, an increase in restructuring costs to £734 million following the recent strategic announcemen
t
and higher litigation and conduct costs of £373 million, partially offset by lower adjusted expenses
falling by 22% to £734 million. Adjusted operating loss was £227 million, compared with a profit o
f
£177 million in Q2 2014.
Note:
(1) The business transfer from CIB to CPB was effective from 1 May 2015. Comparatives were not restated and for the whole period the financials of the UK large corporate
business were: total income of £32 million in H1 2015 (H1 2014 - £31 million; Q2 2015 - £19 million; Q1 2015 - £15 million; Q2 2014 - £16 million); operating expenses o
f
£2 million in H1 2015 (H1 2014 - £4 million; Q2 2015 - £1 million; Q1 2015 - £1 million; Q2 2014 - £2 million); net loans and advances to customers of £2.1 billion (31
March 2015 - £2.0 billion; 31 December 2014 - £1.8 billion); and RWAs of £2.3 billion (31 March 2015 - £2.1 billion; 31 December 2014 - £2.1 billion).