RBS 2014 Annual Report Download - page 181
Download and view the complete annual report
Please find page 181 of the 2014 RBS annual report below. You can navigate through the pages in the report by either clicking on the pages listed below, or by using the keyword search tool below to find specific information within the annual report.-
 1
1 -
2
-
3
-
4
-
5
-
6
-
7
-
8
-
9
-
10
-
11
-
12
-
13
-
14
-
15
-
16
-
17
-
18
-
19
-
20
-
21
-
22
-
23
-
24
-
25
-
26
-
27
-
28
-
29
-
30
-
31
-
32
-
33
-
34
-
35
-
36
-
37
-
38
-
39
-
40
-
41
-
42
-
43
-
44
-
45
-
46
-
47
-
48
-
49
-
50
-
51
-
52
-
53
-
54
-
55
-
56
-
57
-
58
-
59
-
60
-
61
-
62
-
63
-
64
-
65
-
66
-
67
-
68
-
69
-
70
-
71
-
72
-
73
-
74
-
75
-
76
-
77
-
78
-
79
-
80
-
81
-
82
-
83
-
84
-
85
-
86
-
87
-
88
-
89
-
90
-
91
-
92
-
93
-
94
-
95
-
96
-
97
-
98
-
99
-
100
-
101
-
102
-
103
-
104
-
105
-
106
-
107
-
108
-
109
-
110
-
111
-
112
-
113
-
114
-
115
-
116
-
117
-
118
-
119
-
120
-
121
-
122
-
123
-
124
-
125
-
126
-
127
-
128
-
129
-
130
-
131
-
132
-
133
-
134
-
135
-
136
-
137
-
138
-
139
-
140
-
141
-
142
-
143
-
144
-
145
-
146
-
147
-
148
-
149
-
150
-
151
-
152
-
153
-
154
-
155
-
156
-
157
-
158
-
159
-
160
-
161
-
162
-
163
-
164
-
165
-
166
-
167
-
168
-
169
-
170
-
 171
171 -
 172
172 -
 173
173 -
 174
174 -
 175
175 -
 176
176 -
 177
177 -
 178
178 -
 179
179 -
 180
180 -
 181
181 -
 182
182 -
 183
183 -
 184
184 -
 185
185 -
 186
186 -
 187
187 -
 188
188 -
 189
189 -
 190
190 -
 191
191 -
192
-
193
-
194
-
195
-
196
-
197
-
198
-
199
 |
 |

2
RBS – Interim Results 2015
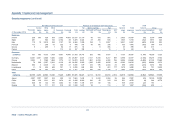
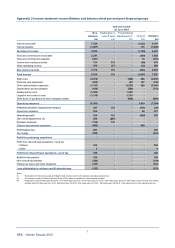
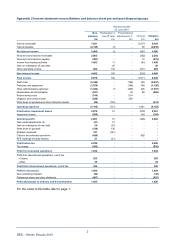
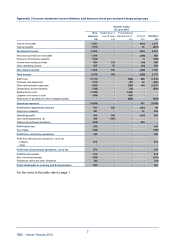
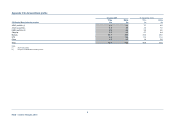
Appendix 2 Income statement reconciliations and balance sheet pre and post disposal groups
Half year ended
30 June 2014
Non- Reallocation o
f
Presentational
statutory one-off items adjustments (1) CFG (2) Statutory
£m £m £m £m £m
Interest receivable 7,621 - - (1,077) 6,544
Interest payable (2,125) (3) - 90 (2,038)
Net interest income 5,496 (3) - (987) 4,506
Fees and commissions receivable 2,605 - - (362) 2,243
Fees and commissions payable (487) - - 12 (475)
Income from trading activities 1,482 11 - (43) 1,450
Gain on redemption of own debt - 20 - - 20
Other operating income 882 154 - (231) 805
Non-interest income 4,482 185 - (624) 4,043
Total income 9,978 182 - (1,611) 8,549
Staff costs (3,340) - (196) 539 (2,997)
Premises and equipment (1,079) - (196) 149 (1,126)
Other administrative expenses (1,292) (1) (369) 305 (1,357)
Depreciation and amortisation (551) - (3) 88 (466)
Restructuring costs (514) - 514 - -
Litigation and conduct costs (250) - 250 - -
Write down of goodwill and other intangible assets (82) (130) - - (212)
Operating expenses (7,108) (131) - 1,081 (6,158)
Profit before impairment losses 2,870 51 - (530) 2,391
Impairment losses (269) - - 104 (165)
Operating profit 2,601 51 - (426) 2,226
Own credit adjustments (3) (51) 51 - - -
Gain on redemption of own debt 20 (20) - - -
Write down of goodwill (130) 130 - - -
Strategic disposals 191 (191) - - -
Citizens discontinued operations (426) - - 426 -
RFS Holdings minority interest 21 (21) - - -
Profit before tax 2,226 - - - 2,226
Tax charge (592) - - - (592)
Profit for continuing operations 1,634 - - - 1,634
Profit from discontinued operations, net of tax
- Citizens 285 - - - 285
- Other 35 - - - 35
Profit from discontinued operations, net of tax 320 - - - 320
Profit for the period 1,954 - - - 1,954
Non-controlling interests (42) - - - (42)
Preference share and other dividends (487) - - - (487)
Profit attributable to ordinary and B shareholders 1,425 - - - 1,425
For the notes to this table refer to page 1.