RBS 2014 Annual Report Download - page 21
Download and view the complete annual report
Please find page 21 of the 2014 RBS annual report below. You can navigate through the pages in the report by either clicking on the pages listed below, or by using the keyword search tool below to find specific information within the annual report.-
 1
1 -
2
-
3
-
4
-
5
-
6
-
7
-
8
-
9
-
10
-
 11
11 -
 12
12 -
 13
13 -
 14
14 -
 15
15 -
 16
16 -
 17
17 -
 18
18 -
 19
19 -
 20
20 -
 21
21 -
 22
22 -
 23
23 -
 24
24 -
 25
25 -
 26
26 -
 27
27 -
 28
28 -
 29
29 -
 30
30 -
 31
31 -
32
-
33
-
34
-
35
-
36
-
37
-
38
-
39
-
40
-
41
-
42
-
43
-
44
-
45
-
46
-
47
-
48
-
49
-
50
-
51
-
52
-
53
-
54
-
55
-
56
-
57
-
58
-
59
-
60
-
61
-
62
-
63
-
64
-
65
-
66
-
67
-
68
-
69
-
70
-
71
-
72
-
73
-
74
-
75
-
76
-
77
-
78
-
79
-
80
-
81
-
82
-
83
-
84
-
85
-
86
-
87
-
88
-
89
-
90
-
91
-
92
-
93
-
94
-
95
-
96
-
97
-
98
-
99
-
100
-
101
-
102
-
103
-
104
-
105
-
106
-
107
-
108
-
109
-
110
-
111
-
112
-
113
-
114
-
115
-
116
-
117
-
118
-
119
-
120
-
121
-
122
-
123
-
124
-
125
-
126
-
127
-
128
-
129
-
130
-
131
-
132
-
133
-
134
-
135
-
136
-
137
-
138
-
139
-
140
-
141
-
142
-
143
-
144
-
145
-
146
-
147
-
148
-
149
-
150
-
151
-
152
-
153
-
154
-
155
-
156
-
157
-
158
-
159
-
160
-
161
-
162
-
163
-
164
-
165
-
166
-
167
-
168
-
169
-
170
-
171
-
172
-
173
-
174
-
175
-
176
-
177
-
178
-
179
-
180
-
181
-
182
-
183
-
184
-
185
-
186
-
187
-
188
-
189
-
190
-
191
-
192
-
193
-
194
-
195
-
196
-
197
-
198
-
199
 |
 |

19
RBS – Interim Results 2015
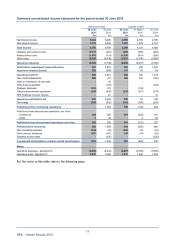
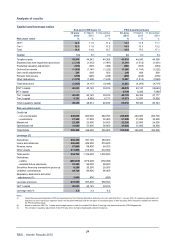
Analysis of results
Half year ended Quarter ended
30 June 30 June 30 June 31 March 30 June
2015 2014 2015 2015 2014
Non-interest income £m £m £m £m £m
Net fees and commissions 1,966 2,118 974 992 1,063
Income from trading activities 734 1,482 464 270 626
Other operating income 478 882 165 313 438
Total non-interest income 3,178 4,482 1,603 1,575 2,127
Key points
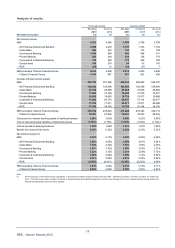
H1 2015 compared with H1 2014
• Non-interest income was down 29%, principally reflecting reduced trading income, in line with CIB’s
risk and resource reduction.
• Losses of £69 million were recorded on the disposal of available-for-sale securities, compared with
gains of £215 million in H1 2014.
Q2 2015 compared with Q1 2015
• Non-interest income was up 2%, reflecting seasonal movements offset by volatile items under IFRS.
Q2 2015 compared with Q2 2014
• Non-interest income was 25% lower, principally reflecting the reduction in CIB’s scale.
• A loss of £42 million on the disposal of available-for-sale securities compared with a gain of £13 million
in Q2 2014.