RBS 2014 Annual Report Download - page 61
Download and view the complete annual report
Please find page 61 of the 2014 RBS annual report below. You can navigate through the pages in the report by either clicking on the pages listed below, or by using the keyword search tool below to find specific information within the annual report.-
 1
1 -
2
-
3
-
4
-
5
-
6
-
7
-
8
-
9
-
10
-
11
-
12
-
13
-
14
-
15
-
16
-
17
-
18
-
19
-
20
-
21
-
22
-
23
-
24
-
25
-
26
-
27
-
28
-
29
-
30
-
31
-
32
-
33
-
34
-
35
-
36
-
37
-
38
-
39
-
40
-
41
-
42
-
43
-
44
-
45
-
46
-
47
-
48
-
49
-
50
-
 51
51 -
 52
52 -
 53
53 -
 54
54 -
 55
55 -
 56
56 -
 57
57 -
 58
58 -
 59
59 -
 60
60 -
 61
61 -
 62
62 -
 63
63 -
 64
64 -
 65
65 -
 66
66 -
 67
67 -
 68
68 -
 69
69 -
 70
70 -
 71
71 -
72
-
73
-
74
-
75
-
76
-
77
-
78
-
79
-
80
-
81
-
82
-
83
-
84
-
85
-
86
-
87
-
88
-
89
-
90
-
91
-
92
-
93
-
94
-
95
-
96
-
97
-
98
-
99
-
100
-
101
-
102
-
103
-
104
-
105
-
106
-
107
-
108
-
109
-
110
-
111
-
112
-
113
-
114
-
115
-
116
-
117
-
118
-
119
-
120
-
121
-
122
-
123
-
124
-
125
-
126
-
127
-
128
-
129
-
130
-
131
-
132
-
133
-
134
-
135
-
136
-
137
-
138
-
139
-
140
-
141
-
142
-
143
-
144
-
145
-
146
-
147
-
148
-
149
-
150
-
151
-
152
-
153
-
154
-
155
-
156
-
157
-
158
-
159
-
160
-
161
-
162
-
163
-
164
-
165
-
166
-
167
-
168
-
169
-
170
-
171
-
172
-
173
-
174
-
175
-
176
-
177
-
178
-
179
-
180
-
181
-
182
-
183
-
184
-
185
-
186
-
187
-
188
-
189
-
190
-
191
-
192
-
193
-
194
-
195
-
196
-
197
-
198
-
199
 |
 |

59
RBS – Interim Results 2015
Citizens Financial Group (US dollar)
Key points (continued)
H1 2015 compared with H1 2014 (continued)
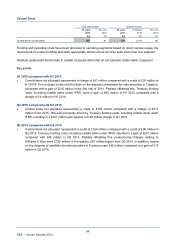
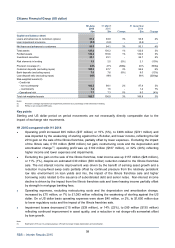
• Average loans and advances were up 18% (8% on a US dollar basis) due to commercial loan growth
and retail loan growth driven by auto, residential mortgage and student loans partially offset by home
equity run-off.
• Average customer deposits were up 16% (6% on a US dollar basis), driven by growth in money
market, term deposits and checking accounts with interest.
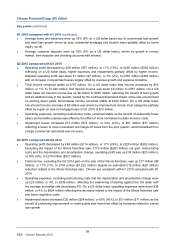
Q2 2015 compared with Q1 2015
• Operating profit decreased by £28 million ($37 million), or 11% (10%), to £229 million ($352 million)
reflecting on a US dollar basis, higher expenses and impairments partially offset by higher income.
Adjusted operating profit was down £7 million ($7 million), or 3% (2%), to £256 million ($392 million)
with an increase in impairment losses largely offset by revenue growth and expense discipline.
• Total income remained stable at £797 million. On a US dollar basis total income increased by $16
million, or 1%, to $1,222 million. Net interest income was down £2 million to £551 million. On a US
dollar basis net interest income was up $8 million to $845 million, reflecting the benefit of loan growth
and an additional day in the quarter, muted by the continued downward impact of the rate environmen
t
on earning asset yields. Non-interest income remained stable at £246 million. On a US dollar basis
non-interest income increase of $8 million was driven by improvement across most categories partiall
y
offset by a gain on sale of mortgage loans in Q1 2015 of $10 million.
• Operating expenses, excluding restructuring costs, remained stable as the benefit of seasonally lowe
r
salary and benefits expense was offset by the effect of more normalised outside services costs.
• Impairment losses increased £13 million ($19 million), or 34% (33%), to £51 million ($77 million)
reflecting a return to more normalised net charge-off levels from the prior quarter, which benefited from
a large commercial real estate loan recovery.
Q2 2015 compared with Q2 2014
• Operating profit decreased by £48 million ($114 million), or 17% (24%), to £229 million ($352 million).
Excluding the impact of the Illinois franchise sale, £170 million ($283 million) net gain, restructuring
costs and the depreciation and amortisation change, operating profit was up £34 million ($23 million),
or 19% (8%), to £210 million ($321 million).
• Total income, excluding the Q2 2014 gain on the sale of the Illinois franchise, was up £77 million ($9
million), or 11% (1%), to £797 million ($1,222 million) despite an estimated £15 million ($25 million)
reduction related to the Illinois franchise sale. Drivers are consistent with H1 2015 compared with H1
2014.
• Operating expenses, excluding restructuring costs and the depreciation and amortisation change were
up £23 million, or 4%, to £536 million, reflecting the weakening of sterling against the US dollar with
the average exchange rate decreasing 9%. On a US dollar basis operating expenses were down $38
million, or 4%, to $824 million reflecting the decrease related to the impact of the Illinois franchise sale
and lower regulatory costs.
• Impairment losses increased £20 million ($24 million), or 65% (45%), to £51 million ($77 million) as the
benefit of underlying improvement in credit quality was more than offset by increases related to overall
loan growth.