RBS 2014 Annual Report Download - page 144
Download and view the complete annual report
Please find page 144 of the 2014 RBS annual report below. You can navigate through the pages in the report by either clicking on the pages listed below, or by using the keyword search tool below to find specific information within the annual report.-
 1
1 -
2
-
3
-
4
-
5
-
6
-
7
-
8
-
9
-
10
-
11
-
12
-
13
-
14
-
15
-
16
-
17
-
18
-
19
-
20
-
21
-
22
-
23
-
24
-
25
-
26
-
27
-
28
-
29
-
30
-
31
-
32
-
33
-
34
-
35
-
36
-
37
-
38
-
39
-
40
-
41
-
42
-
43
-
44
-
45
-
46
-
47
-
48
-
49
-
50
-
51
-
52
-
53
-
54
-
55
-
56
-
57
-
58
-
59
-
60
-
61
-
62
-
63
-
64
-
65
-
66
-
67
-
68
-
69
-
70
-
71
-
72
-
73
-
74
-
75
-
76
-
77
-
78
-
79
-
80
-
81
-
82
-
83
-
84
-
85
-
86
-
87
-
88
-
89
-
90
-
91
-
92
-
93
-
94
-
95
-
96
-
97
-
98
-
99
-
100
-
101
-
102
-
103
-
104
-
105
-
106
-
107
-
108
-
109
-
110
-
111
-
112
-
113
-
114
-
115
-
116
-
117
-
118
-
119
-
120
-
121
-
122
-
123
-
124
-
125
-
126
-
127
-
128
-
129
-
130
-
131
-
132
-
133
-
 134
134 -
 135
135 -
 136
136 -
 137
137 -
 138
138 -
 139
139 -
 140
140 -
 141
141 -
 142
142 -
 143
143 -
 144
144 -
 145
145 -
 146
146 -
 147
147 -
 148
148 -
 149
149 -
 150
150 -
 151
151 -
 152
152 -
 153
153 -
 154
154 -
155
-
156
-
157
-
158
-
159
-
160
-
161
-
162
-
163
-
164
-
165
-
166
-
167
-
168
-
169
-
170
-
171
-
172
-
173
-
174
-
175
-
176
-
177
-
178
-
179
-
180
-
181
-
182
-
183
-
184
-
185
-
186
-
187
-
188
-
189
-
190
-
191
-
192
-
193
-
194
-
195
-
196
-
197
-
198
-
199
 |
 |
9
RBS – Interim Results 2015
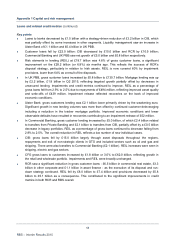
Appendix 1 Capital and risk management
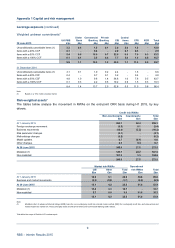
Leverage exposure (continued)
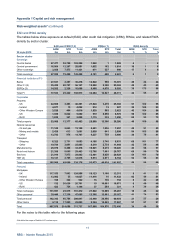
Weighted undrawn commitments*
Ulste
r
Commercial Private Central
UK PBB Bank Banking Banking CIB items CFG RCR Total
30 June 2015 £bn £bn £bn £bn £bn £bn £bn £bn £bn
Unconditionally cancellable items (1) 3.2 0.4 1.2 0.1 3.6 2.6 1.8 - 12.9
Items with a 20% CCF 0.1 - 0.4 - 2.0 0.1 0.3 - 2.9
Items with a 50% CCF 5.4 0.6 15.0 0.7 22.5 0.8 7.9 0.3 53.2
Items with a 100% CCF 0.1 0.1 2.2 0.4 7.7 3.6 1.4 0.2 15.7
8.8 1.1 18.8 1.2 35.8 7.1 11.4 0.5 84.7
31 December 2014
Unconditionally cancellable items (1) 3.1 0.1 1.0 0.2 2.4 - 1.8 - 8.6
Items with a 20% CCF 0.4 - 0.7 0.1 3.2 - 0.4 - 4.8
Items with a 50% CCF 4.8 1.0 9.8 1.4 36.8 1.6 7.8 0.5 63.7
Items with a 100% CCF 0.1 0.3 2.2 0.8 10.2 3.9 1.5 0.3 19.3
8.4 1.4 13.7 2.5 52.6 5.5 11.5 0.8 96.4
Note:
(1) Based on a 10% credit conversion factor.
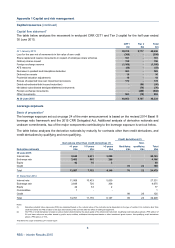
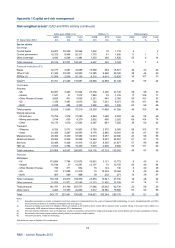
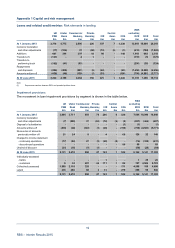
Risk-weighted assets*
The tables below analyse the movement in RWAs on the end-point CRR basis during H1 2015, by key
drivers.
Credit risk RWAs
Non-counterparty Counterparty Total
£bn £bn £bn
A
t 1 January 2015 264.7 30.4 295.1
Foreign exchange movement (3.5) 0.1 (3.4)
Business movements (12.9) (3.3) (16.2)
Risk parameter changes (4.1) - (4.1)
Methodology changes (0.2) - (0.2)
Model updates 0.7 (0.1) 0.6
Other changes 0.3 0.4 0.7
At 30 June 2015 245.0 27.5 272.5
Modelled (1) 143.7 24.2 167.9
Non-modelled 101.3 3.3 104.6
245.0 27.5 272.5
Market risk RWAs Operational
CIB Othe
r
Total risk RWAs Total
£bn £bn £bn £bn £bn
A
t 1 January 2015 18.9 5.1 24.0 36.8 60.8
Business and market movements (0.8) (0.9) (1.7) (5.2) (6.9)
At 30 June 2015 18.1 4.2 22.3 31.6 53.9
Modelled (1) 15.4 3.3 18.7 - 18.7
Non-modelled 2.7 0.9 3.6 31.6 35.2
18.1 4.2 22.3 31.6 53.9
Note:
(1) Modelled refers to advanced internal ratings (AIRB) basis for non-counterparty credit risk, internal model method (IMM) for counterparty credit risk, and value-at-risk and
related models for market risk. These principally relate to CIB (£71.8 billion) and Commercial Banking (£50.5 billion).
*Not within the scope of Deloitte LLP’s review report