RBS 2014 Annual Report Download - page 169
Download and view the complete annual report
Please find page 169 of the 2014 RBS annual report below. You can navigate through the pages in the report by either clicking on the pages listed below, or by using the keyword search tool below to find specific information within the annual report.-
 1
1 -
2
-
3
-
4
-
5
-
6
-
7
-
8
-
9
-
10
-
11
-
12
-
13
-
14
-
15
-
16
-
17
-
18
-
19
-
20
-
21
-
22
-
23
-
24
-
25
-
26
-
27
-
28
-
29
-
30
-
31
-
32
-
33
-
34
-
35
-
36
-
37
-
38
-
39
-
40
-
41
-
42
-
43
-
44
-
45
-
46
-
47
-
48
-
49
-
50
-
51
-
52
-
53
-
54
-
55
-
56
-
57
-
58
-
59
-
60
-
61
-
62
-
63
-
64
-
65
-
66
-
67
-
68
-
69
-
70
-
71
-
72
-
73
-
74
-
75
-
76
-
77
-
78
-
79
-
80
-
81
-
82
-
83
-
84
-
85
-
86
-
87
-
88
-
89
-
90
-
91
-
92
-
93
-
94
-
95
-
96
-
97
-
98
-
99
-
100
-
101
-
102
-
103
-
104
-
105
-
106
-
107
-
108
-
109
-
110
-
111
-
112
-
113
-
114
-
115
-
116
-
117
-
118
-
119
-
120
-
121
-
122
-
123
-
124
-
125
-
126
-
127
-
128
-
129
-
130
-
131
-
132
-
133
-
134
-
135
-
136
-
137
-
138
-
139
-
140
-
141
-
142
-
143
-
144
-
145
-
146
-
147
-
148
-
149
-
150
-
151
-
152
-
153
-
154
-
155
-
156
-
157
-
158
-
 159
159 -
 160
160 -
 161
161 -
 162
162 -
 163
163 -
 164
164 -
 165
165 -
 166
166 -
 167
167 -
 168
168 -
 169
169 -
 170
170 -
 171
171 -
 172
172 -
 173
173 -
 174
174 -
 175
175 -
 176
176 -
 177
177 -
 178
178 -
 179
179 -
180
-
181
-
182
-
183
-
184
-
185
-
186
-
187
-
188
-
189
-
190
-
191
-
192
-
193
-
194
-
195
-
196
-
197
-
198
-
199
 |
 |

34
RBS – Interim Results 2015
Appendix 1 Capital and risk management
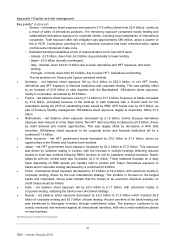
Market risk
Market risk is the risk of losses arising from fluctuations in interest rates, credit spreads, foreign currency rates, equity prices, commodity prices and other factors,
such as market volatilities, that may lead to a reduction in earnings, economic value or both. For a description of market risk framework, governance, policies and
methodologies, refer to Capital and risk management - Market risk in the 2014 Annual Report and Accounts. There were no material changes to market risk
methodologies or models during H1 2015.
Trading portfolios
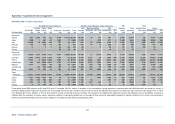
Value-at-risk
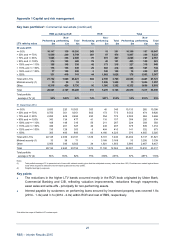
The table below presents the internal value-at-risk (VaR) for trading portfolios split by type of market risk exposure and by business area. The internal traded 99%
one-day VaR captures all trading book positions. By contrast, the regulatory VaR-based charges take into account only regulator-approved products, locations and
legal entities and are based on a ten-day, rather than a one-day, holding period for market risk capital calculations.
Half year ended Year ended
30 June 2015 30 June 2014 31 December 2014
Average Period end Maximum Minimum Average Period end Maximum Minimum Average Period end Maximum Minimum
Trading VaR (1-day 99%) £m £m £m £m £m £m £m £m £m £m £m £m
Interest rate 16.0 11.7 29.8 10.8 16.7 14.9 39.8 10.9 17.4 16.9 39.8 10.8
Credit spread 12.5 7.6 16.4 7.5 28.3 24.4 42.8 20.9 23.1 14.2 42.8 13.4
Currency 5.3 5.4 7.8 3.3 5.4 3.0 8.5 2.0 4.7 5.5 9.7 1.0
Equity 2.4 1.2 6.1 1.0 3.5 2.5 6.0 2.1 3.0 3.7 6.5 1.2
Commodity 0.5 0.7 2.2 0.2 0.6 0.7 1.4 0.3 0.6 0.4 2.5 0.3
Diversification (1) (11.6) (24.8) (18.2)
Total 21.8 15.0 30.1 15.0 30.6 20.7 58.2 20.7 27.8 22.5 58.2 17.1
CIB 21.1 14.2 29.8 14.0 28.2 21.3 48.8 20.5 26.3 21.3 48.8 15.5
RCR 3.1 2.8 4.5 2.6 6.0 3.5 16.2 3.3 4.5 3.0 16.2 2.6
Note:
(1) RBS benefits from diversification as it reduces risk by allocating positions across various financial instrument types, currencies and markets. The extent of the diversification benefit depends on the correlation between the assets and risk factors in the portfolio at a
particular time. The diversification factor is the sum of the VaR on individual risk types less the total portfolio VaR.
Key points
• During H1 2015, trading book exposure continued to decline. The markets exhibited higher volatility and reduced liquidity, resulting from a number o
f
macroeconomic factors, including ongoing political and economic uncertainty in Europe and growing concerns regarding economic slowdown in China.
• The period end and average total traded internal VaR were lower than in 2014, primarily in credit spread VaR resulting from the ongoing exit of the US asset-
backed products (ABP) trading business.