RBS 2014 Annual Report Download - page 149
Download and view the complete annual report
Please find page 149 of the 2014 RBS annual report below. You can navigate through the pages in the report by either clicking on the pages listed below, or by using the keyword search tool below to find specific information within the annual report.-
 1
1 -
2
-
3
-
4
-
5
-
6
-
7
-
8
-
9
-
10
-
11
-
12
-
13
-
14
-
15
-
16
-
17
-
18
-
19
-
20
-
21
-
22
-
23
-
24
-
25
-
26
-
27
-
28
-
29
-
30
-
31
-
32
-
33
-
34
-
35
-
36
-
37
-
38
-
39
-
40
-
41
-
42
-
43
-
44
-
45
-
46
-
47
-
48
-
49
-
50
-
51
-
52
-
53
-
54
-
55
-
56
-
57
-
58
-
59
-
60
-
61
-
62
-
63
-
64
-
65
-
66
-
67
-
68
-
69
-
70
-
71
-
72
-
73
-
74
-
75
-
76
-
77
-
78
-
79
-
80
-
81
-
82
-
83
-
84
-
85
-
86
-
87
-
88
-
89
-
90
-
91
-
92
-
93
-
94
-
95
-
96
-
97
-
98
-
99
-
100
-
101
-
102
-
103
-
104
-
105
-
106
-
107
-
108
-
109
-
110
-
111
-
112
-
113
-
114
-
115
-
116
-
117
-
118
-
119
-
120
-
121
-
122
-
123
-
124
-
125
-
126
-
127
-
128
-
129
-
130
-
131
-
132
-
133
-
134
-
135
-
136
-
137
-
138
-
 139
139 -
 140
140 -
 141
141 -
 142
142 -
 143
143 -
 144
144 -
 145
145 -
 146
146 -
 147
147 -
 148
148 -
 149
149 -
 150
150 -
 151
151 -
 152
152 -
 153
153 -
 154
154 -
 155
155 -
 156
156 -
 157
157 -
 158
158 -
 159
159 -
160
-
161
-
162
-
163
-
164
-
165
-
166
-
167
-
168
-
169
-
170
-
171
-
172
-
173
-
174
-
175
-
176
-
177
-
178
-
179
-
180
-
181
-
182
-
183
-
184
-
185
-
186
-
187
-
188
-
189
-
190
-
191
-
192
-
193
-
194
-
195
-
196
-
197
-
198
-
199
 |
 |

14
RBS – Interim Results 2015
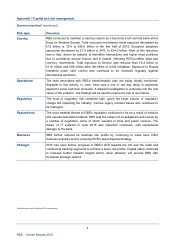
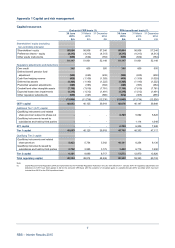
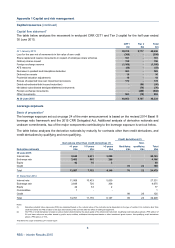
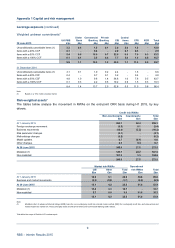
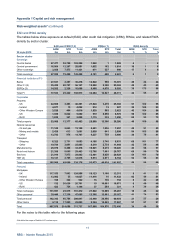
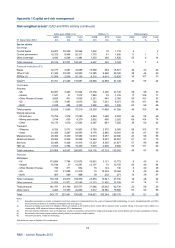
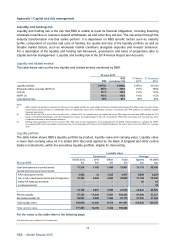
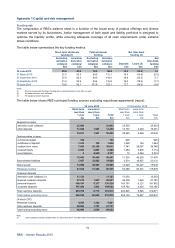
Appendix 1 Capital and risk management
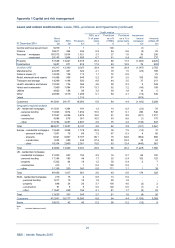
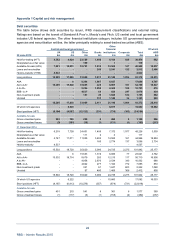
Liquidity portfolio (continued)
Liquidity value
Period end Average
UK DLG (1) CFG Othe
r
Total Quarte
r
Yea
r
31 December 2014 £m £m £m £m £m £m
Cash and balances at central banks 66,409 1,368 633 68,410 61,777 61,956
Central and local government bonds
AAA rated governments and US agencies 5,609 -2,289 7,898 8,729 5,935
AA- to AA+ rated governments 6,902 9,281 1,448 17,631 16,589 12,792
Below AA rated governments - -100 100 - -
Local government - -82 82 79 21
12,511 9,281 3,919 25,711 25,397 18,748
Primary liquidity 78,920 10,649 4,552 94,121 87,174 80,704
Secondary liquidity (2) 53,055 2,290 1,189 56,534 57,582 56,017
Total liquidity value 131,975 12,939 5,741 150,655 144,756 136,721
Total carrying value 167,016 13,914 6,055 186,985
Notes:
(1) The PRA regulated UK Defined Liquidity Group (UK DLG) comprises the RBS’s five licensed deposit-taking UK banks: The Royal Bank of Scotland plc, National
Westminster Bank Plc, Ulster Bank Limited, Coutts & Company and Adam & Company. In addition, certain of RBS’s significant operating subsidiaries - RBS N.V., Citizens
Financial Group Inc. and Ulster Bank Ireland Limited - hold liquidity portfolios of liquid assets that comply with local regulations that may differ from PRA rules.
(2) Comprises assets eligible for discounting at the Bank of England and other central banks.