RBS 2014 Annual Report Download - page 66
Download and view the complete annual report
Please find page 66 of the 2014 RBS annual report below. You can navigate through the pages in the report by either clicking on the pages listed below, or by using the keyword search tool below to find specific information within the annual report.-
 1
1 -
2
-
3
-
4
-
5
-
6
-
7
-
8
-
9
-
10
-
11
-
12
-
13
-
14
-
15
-
16
-
17
-
18
-
19
-
20
-
21
-
22
-
23
-
24
-
25
-
26
-
27
-
28
-
29
-
30
-
31
-
32
-
33
-
34
-
35
-
36
-
37
-
38
-
39
-
40
-
41
-
42
-
43
-
44
-
45
-
46
-
47
-
48
-
49
-
50
-
51
-
52
-
53
-
54
-
55
-
 56
56 -
 57
57 -
 58
58 -
 59
59 -
 60
60 -
 61
61 -
 62
62 -
 63
63 -
 64
64 -
 65
65 -
 66
66 -
 67
67 -
 68
68 -
 69
69 -
 70
70 -
 71
71 -
 72
72 -
 73
73 -
 74
74 -
 75
75 -
 76
76 -
77
-
78
-
79
-
80
-
81
-
82
-
83
-
84
-
85
-
86
-
87
-
88
-
89
-
90
-
91
-
92
-
93
-
94
-
95
-
96
-
97
-
98
-
99
-
100
-
101
-
102
-
103
-
104
-
105
-
106
-
107
-
108
-
109
-
110
-
111
-
112
-
113
-
114
-
115
-
116
-
117
-
118
-
119
-
120
-
121
-
122
-
123
-
124
-
125
-
126
-
127
-
128
-
129
-
130
-
131
-
132
-
133
-
134
-
135
-
136
-
137
-
138
-
139
-
140
-
141
-
142
-
143
-
144
-
145
-
146
-
147
-
148
-
149
-
150
-
151
-
152
-
153
-
154
-
155
-
156
-
157
-
158
-
159
-
160
-
161
-
162
-
163
-
164
-
165
-
166
-
167
-
168
-
169
-
170
-
171
-
172
-
173
-
174
-
175
-
176
-
177
-
178
-
179
-
180
-
181
-
182
-
183
-
184
-
185
-
186
-
187
-
188
-
189
-
190
-
191
-
192
-
193
-
194
-
195
-
196
-
197
-
198
-
199
 |
 |

64
RBS – Interim Results 2015
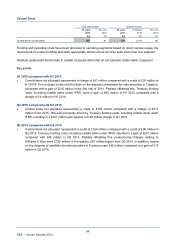
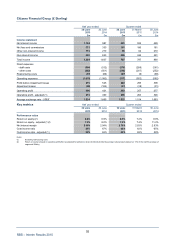
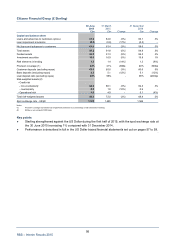
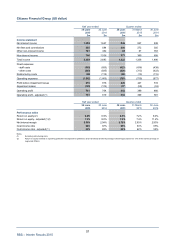
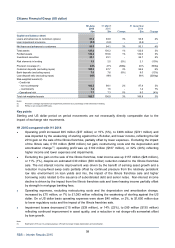
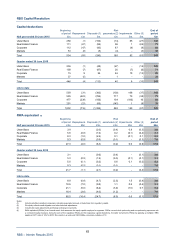
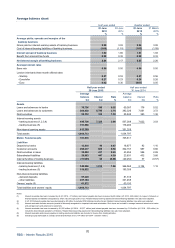
RBS Capital Resolution
Gross loans and advances, REIL and impairments
Credit metrics Year-to-date
REIL as a Provisions Provisions Impairment
Gross % of gross as a % as a % o
f
(releases)/ Amounts
loans REIL Provisions loans of REIL gross loans losses (2) written-of
f
30 June 2015 (1) £bn £bn £bn % % % £m £m
By sector:
Commercial real estate
- investment 3.4 2.7 1.4 79 52 41 (114) 1,302
- development 2.7 2.6 2.3 96 88 85 (25) 2,573
A
sset finance 1.2 0.4 0.2 33 50 17 7 226
Other corporate 3.7 1.7 1.2 46 71 32 (161) 871
Total 11.0 7.4 5.1 67 69 46 (293) 4,972
By donating segment
and sector
Ulster Bank
Commercial real estate
- investment 1.3 1.3 0.9 100 69 69 1 990
- development 2.4 2.4 2.2 100 92 92 (79) 2,511
Other corporate 1.0 0.9 0.8 90 89 80 (94) 605
Total Ulster Bank 4.7 4.6 3.9 98 85 83 (172) 4,106
Commercial Banking
Commercial real estate
- investment 0.9 0.5 0.1 56 20 11 (20) 118
- development 0.2 0.1 0.1 50 100 50 (8) 52
Other corporate 0.5 0.3 0.1 60 33 20 (44) 118
Total Commercial Banking 1.6 0.9 0.3 56 33 19 (72) 288
CIB
Commercial real estate
- investment 1.2 0.9 0.4 75 44 33 (95) 194
- development 0.1 0.1 -100 -- 62 10
A
sset finance 1.2 0.4 0.2 33 50 17 7 226
Other corporate 2.2 0.5 0.3 23 60 14 (23) 148
Total CIB 4.7 1.9 0.9 40 47 19 (49) 578
Total 11.0 7.4 5.1 67 69 46 (293) 4,972
Of which:
UK 5.6 3.2 1.7 57 53 30 (57) 2,326
Europe 5.1 4.1 3.3 80 80 65 (270) 2,622
US 0.2 - -- -- 44 1
RoW 0.1 0.1 0.1 100 100 100 (10) 23
Customers 11.0 7.4 5.1 67 69 46 (293) 4,972
Banks 0.6 - -- -- - 9
Total 11.6 7.4 5.1 64 69 44 (293) 4,981
For the notes to this table refer to the following page.